
- More than half of homes are selling above asking price in Newark, San Francisco, San Jose and Nassau County, making them the most competitive markets in the nation. The AI boom is leading to bidding wars in the Bay Area, and in the Northeast, many metros are seller’s markets.
- The least competitive markets are in Florida and Texas, where less than 10% of homes are selling above asking price. In those seller’s markets, demand has failed to keep up with supply.
- Nationwide, about one-quarter of homes are selling above asking price, indicating bidding wars. Most homes are selling below asking price, signaling that buyers have the power.
Homebuyers are battling for homes in New York City suburbs and the Bay Area, pushing up prices.
Nearly three in five (57.6%) homes in Newark, NJ, sold above their original asking price in May, the highest share of the 50 most populous U.S. metros.
The Bay Area followed closely behind, with 57.3% of homes in San Francisco and 53.2% in San Jose selling above asking. Nassau County, NY rounds out the four metro areas where more than half of homes that sold in May went for above asking price (51.6%). A third Bay Area metro, Oakland, is number five, with 46% of homes selling over asking price.
All in all, six of the 10 most competitive U.S. housing markets are in the Northeast, and three are in the Bay Area. Milwaukee, where 42.6% of homes are selling above asking price, is also in the top 10.
| Top 10 Most Competitive Housing Markets
Measured by share of homes sold above asking price, out of 50 most populous U.S. metro areas |
|||
| Rank | U.S. metro area | Share of homes sold above original list price | Share of homes sold above original list price, YoY change |
| 1 | Newark, NJ | 57.6% | -2.5 pts. |
| 2 | San Francisco, CA | 57.3% | 8.6 pts. |
| 3 | San Jose, CA | 53.2% | 1.7 pts. |
| 4 | Nassau County, NY | 51.6% | 3.3 pts. |
| 5 | Oakland, CA | 46.0% | 4.3 pts. |
| 6 | Providence, RI | 43.8% | -0.0 pts. |
| 7 | Montgomery County, PA | 43.6% | -2.9 pts. |
| 8 | Milwaukee, WI | 42.6% | -0.3 pts. |
| 9 | Boston, MA | 42.1% | -3.9 pts. |
| 10 | New Brunswick, NJ | 39.3% | -4.4 pts. |
The AI boom is driving fierce homebuying demand and competition in the Bay Area; employees of AI companies are collecting big salaries and bonuses, and many of them are putting it toward real estate. San Jose and San Francisco led the nation in home-sale growth in May, with both metros posting double-digit annual increases, and prices in San Francisco are growing faster than anywhere else in the country.
Newark and Nassau County (Long Island) are suburbs of New York City, and New Brunswick, NJ is further flung, but still within commuting distance. Three other East Coast metros rank among the top 10, too: Providence, RI (43.8%), Montgomery County, PA (43.6%), and Boston (42.1%). Buyers are bidding prices up in those places because most of them are seller’s markets. Newark, Nassau County, Providence, Montgomery County, New Brunswick and San Francisco are six of just seven seller’s markets in the U.S., and Boston is a balanced market. When there are more homebuyers than sellers, homes are more likely to sell over asking price.
New York City suburbs are perennially popular because they’re in proximity to one of the biggest job centers in the country, and homes are typically less expensive than they are in Manhattan. It’s also difficult to build new homes in New York City suburbs due to tight regulations, which can push prices up.
Nationwide, This Is the Least Competitive Springtime Since 2020
The Bay Area and the Northeast are bucking the national trend.
Roughly one-quarter (25.8%) of U.S. homes that sold in May went for above their original asking price. That’s the lowest May share since 2020, when the housing market was reeling from the start of the pandemic.
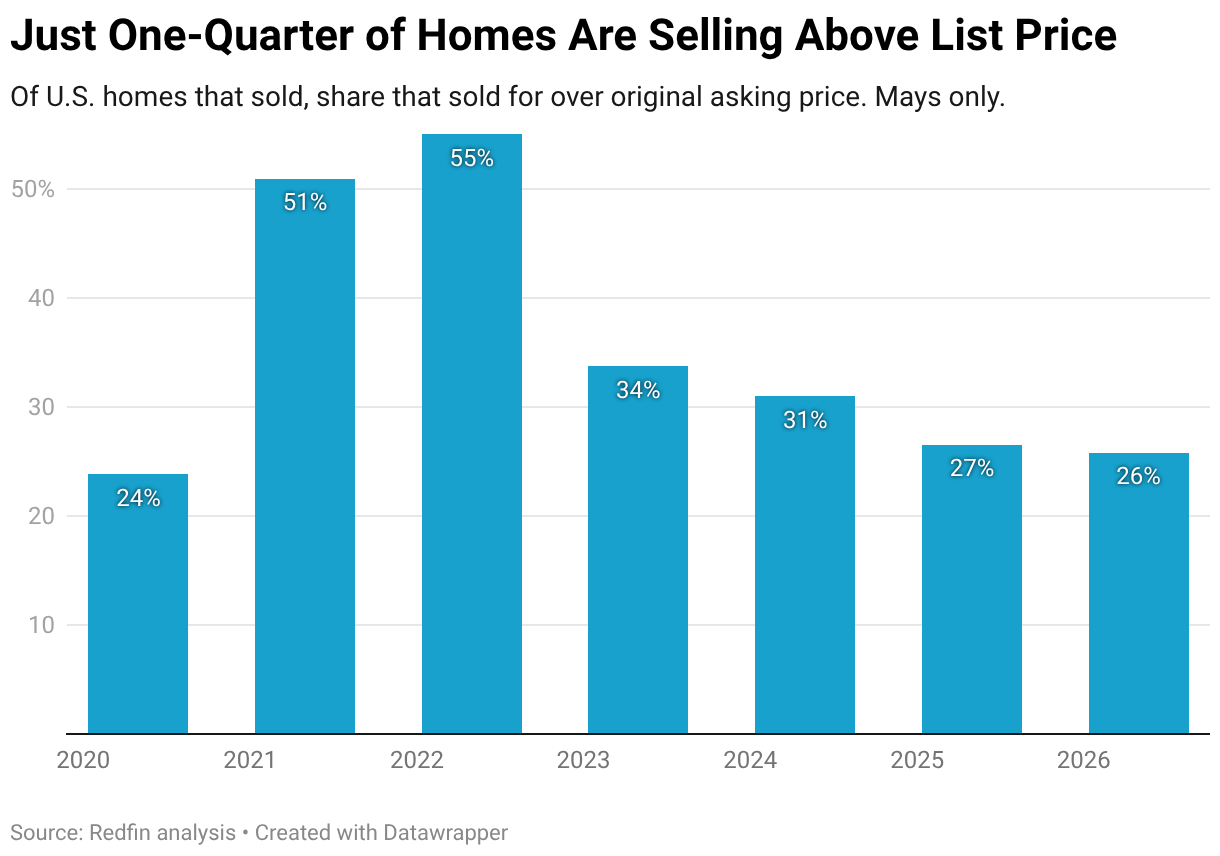
On the flip side, more than half (55%) of homes sold below their asking price in May. The remainder sold at asking price. This is according to a Redfin analysis of MLS data.
Most home sellers are getting less money than they want because of today’s strong buyer’s market. There are hundreds of thousands more home sellers than buyers in the U.S. because high mortgage rates, stubbornly high home prices and widespread economic uncertainty are pushing many would-be buyers to the sidelines.
That means many of the house hunters who are in the market can negotiate price reductions and seller concessions. With total inventory at its highest level since 2020 on a seasonally adjusted basis, buyers have more options and less urgency to compete aggressively for any single listing.
“Buyers know they have the power, and they’re using it,” said Juan Castro, a Redfin Premier agent in Orlando, FL. “Buyers are asking for closing cost credits, mortgage-rate buydowns, and lower prices to get the deal done. Sometimes they complete the inspection, find something minor, and negotiate aggressively before agreeing to close the deal. I’ve seen buyers ask for a completely new roof because it’s missing three shingles, and I’ve seen buyers ask for a $10,000 repair credit.”
In Florida, Fewer Than 1 in 10 Homes Sell Above Asking Price
Florida and Texas metros generally have a much lower share of homes selling above asking price than the national average, signaling softer competition.
Fewer than 10% of homes sold above asking in West Palm Beach, FL (6.6%), Miami (7.4%), San Antonio (8.5%), Austin, TX (9.1%), Houston (9.1%), Orlando (9.4%) and Tampa, FL (9.9%). Those are all among the strongest buyer’s markets in the country, with more than twice as many buyers as sellers in Miami, Austin and Houston. When there are many more sellers than buyers, house hunters typically don’t need to compete for homes; that means homes are more likely to sell under asking price than over asking price.
Supply is strong in these places because many of them have seen a surge in new construction, but those listings are piling up as the increasing frequency of natural disasters, rising insurance and HOA costs and the end of the remote-work era weakens demand.
| Metro-Level Summary: Competition for Home Listings, May 2026
50 most populous U.S. metro areas Data is seasonally adjusted |
||||
| U.S. metro area | Share of homes sold ABOVE original list price | Share of homes sold ABOVE original list price, YoY change | Share of homes sold BELOW original list price | Share of homes sold BELOW original list price, YoY change |
| Anaheim, CA | 29.5% | -0.3 pts. | 61.4% | 2.1 pts. |
| Atlanta, GA | 14.3% | -1.0 pts. | 71.1% | 2.4 pts. |
| Austin, TX | 9.1% | 0.3 pts. | 85.4% | 0.9 pts. |
| Baltimore, MD | 35.8% | -1.4 pts. | 47.0% | 2.4 pts. |
| Boston, MA | 42.1% | -3.9 pts. | 48.0% | 4.7 pts. |
| Charlotte, NC | 14.1% | -1.5 pts. | 69.8% | 0.4 pts. |
| Chicago, IL | 36.9% | 1.2 pts. | 48.8% | -2.6 pts. |
| Cincinnati, OH | 23.3% | -1.8 pts. | 60.4% | 2.3 pts. |
| Cleveland, OH | 32.1% | -1.2 pts. | 55.9% | 1.9 pts. |
| Columbus, OH | 25.5% | -0.7 pts. | 56.2% | 0.4 pts. |
| Dallas, TX | 10.6% | 1.5 pts. | 79.3% | -3.4 pts. |
| Denver, CO | 15.7% | -0.3 pts. | 70.6% | 3.0 pts. |
| Detroit, MI | 32.1% | 0.4 pts. | 54.0% | 1.9 pts. |
| Fort Worth, TX | 13.5% | 1.3 pts. | 73.4% | -2.3 pts. |
| Houston, TX | 9.1% | -0.4 pts. | 79.6% | 1.4 pts. |
| Indianapolis, IN | 14.1% | -1.1 pts. | 67.9% | 1.9 pts. |
| Jacksonville, FL | 10.3% | 2.1 pts. | 72.4% | -6.6 pts. |
| Kansas City, MO | 30.4% | -0.8 pts. | 50.6% | 0.5 pts. |
| Las Vegas, NV | 12.8% | 0.4 pts. | 71.0% | 0.5 pts. |
| Los Angeles, CA | 34.0% | -1.3 pts. | 56.6% | 2.1 pts. |
| Miami, FL | 7.4% | 0.8 pts. | 84.1% | 0.6 pts. |
| Milwaukee, WI | 42.6% | -0.3 pts. | 43.6% | -1.1 pts. |
| Minneapolis, MN | 29.8% | -1.1 pts. | 50.5% | 1.0 pts. |
| Montgomery County, PA | 43.6% | -2.9 pts. | 43.2% | 1.8 pts. |
| Nashville, TN | 12.3% | 0.3 pts. | 64.8% | 1.6 pts. |
| Nassau County, NY | 51.6% | 3.3 pts. | 42.1% | -2.4 pts. |
| New Brunswick, NJ | 39.3% | -4.4 pts. | 48.8% | 3.9 pts. |
| New York, NY | 33.1% | 0.5 pts. | 54.9% | -1.0 pts. |
| Newark, NJ | 57.6% | -2.5 pts. | 32.6% | 3.2 pts. |
| Oakland, CA | 46.0% | 4.3 pts. | 45.2% | -4.5 pts. |
| Orlando, FL | 9.4% | 0.5 pts. | 75.8% | -0.0 pts. |
| Philadelphia, PA | 29.1% | 1.5 pts. | 56.2% | -2.6 pts. |
| Phoenix, AZ | 10.9% | 0.4 pts. | 76.1% | -0.1 pts. |
| Pittsburgh, PA | 20.6% | -1.7 pts. | 63.6% | 0.9 pts. |
| Portland, OR | 26.2% | 0.9 pts. | 54.3% | -2.8 pts. |
| Providence, RI | 43.8% | -0.0 pts. | 42.0% | -0.8 pts. |
| Riverside, CA | 28.8% | 2.0 pts. | 58.7% | -1.5 pts. |
| Sacramento, CA | 28.4% | 4.5 pts. | 56.1% | -4.6 pts. |
| San Antonio, TX | 8.5% | -0.3 pts. | 84.0% | 1.5 pts. |
| San Diego, CA | 31.1% | 1.0 pts. | 59.3% | -1.3 pts. |
| San Francisco, CA | 57.3% | 8.6 pts. | 31.6% | -11.4 pts. |
| San Jose, CA | 53.2% | 1.7 pts. | 43.4% | -0.5 pts. |
| Seattle, WA | 16.4% | -6.3 pts. | 59.2% | 8.6 pts. |
| St. Louis, MO | 34.7% | 0.4 pts. | 48.8% | -0.9 pts. |
| Tampa, FL | 9.9% | 0.0 pts. | 77.1% | 0.9 pts. |
| Virginia Beach, VA | 28.6% | -1.8 pts. | 42.3% | 1.5 pts. |
| Warren, MI | 30.1% | -2.2 pts. | 56.8% | 1.9 pts. |
| Washington, DC | 30.6% | 0.3 pts. | 48.8% | -0.8 pts. |
| West Palm Beach, FL | 6.6% | 2.5 pts. | 85.3% | -3.2 pts. |