The U.S. current-account deficit resulting from international economic transactions widened by $5.8 billion, or 2.6 percent, to $226.8 billion in the first quarter of 2026, according to statistics released today by the U.S. Bureau of Economic Analysis. The revised fourth-quarter deficit was $221.1 billion.
The first-quarter deficit was 2.9 percent of current-dollar gross domestic product, up from 2.8 percent in the fourth quarter.
The $5.8 billion widening of the current-account deficit in the first quarter reflected a shift in the balance on primary income from a surplus in the fourth quarter to a deficit in the first quarter that was partly offset by a reduced deficit on goods.

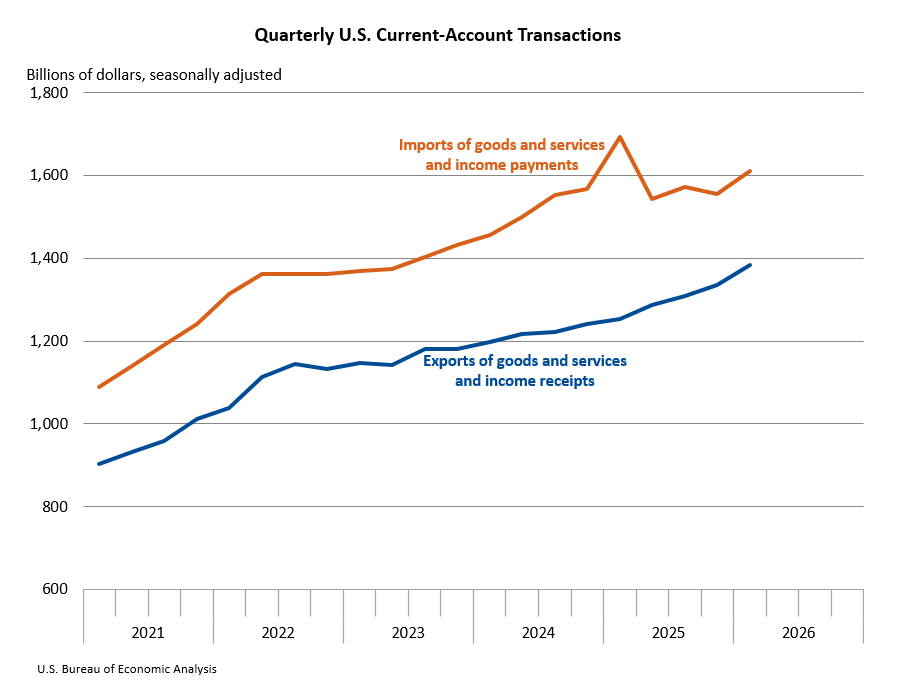
Exports of goods and services to, and income received from, foreign residents increased $50.0 billion to $1.38 trillion in the first quarter, reflecting an increase in goods exports that was partly offset by a decrease in primary (earned) income receipts.
Imports of goods and services from, and income paid to, foreign residents increased $55.8 billion to $1.61 trillion, reflecting increases in goods imports and in primary (earned) income payments.
Capital-transfer receipts increased $3.3 billion to $3.4 billion in the first quarter. Capital-transfer payments decreased $0.9 billion to $2.0 billion.
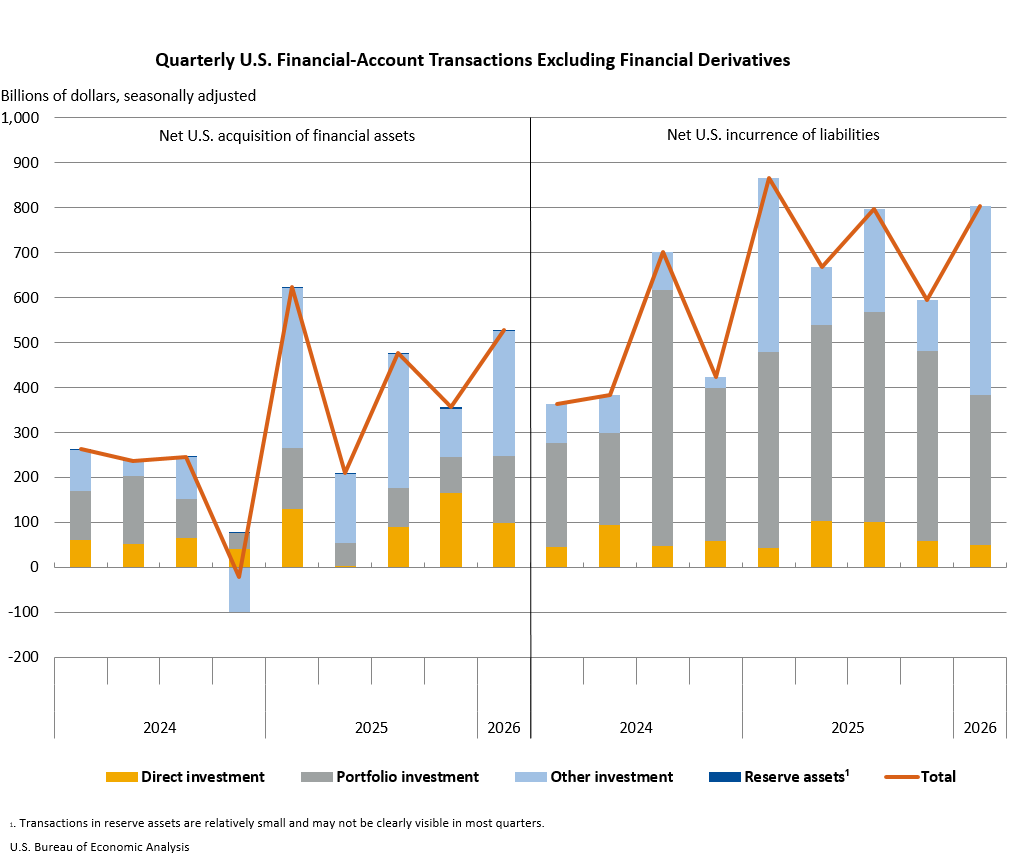
Net financial-account transactions were $209.0 billion in the first quarter, reflecting net U.S. borrowing from foreign residents.1 First-quarter transactions increased U.S. residents’ foreign financial assets by $527.3 billion and increased U.S. liabilities to foreign residents by $803.7 billion.
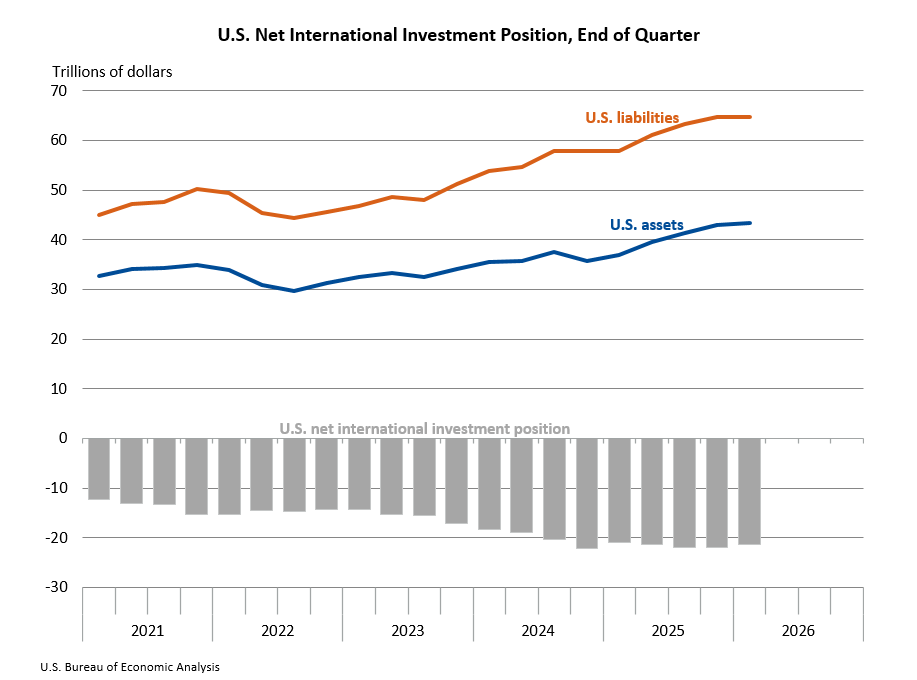
The U.S. net international investment position, the difference between U.S. residents’ foreign financial assets and liabilities, was –$21.27 trillion at the end of the first quarter of 2026. Assets totaled $43.37 trillion, and liabilities totaled $64.64 trillion. At the end of the fourth quarter of 2025, the net investment position was –$21.87 trillion (revised).
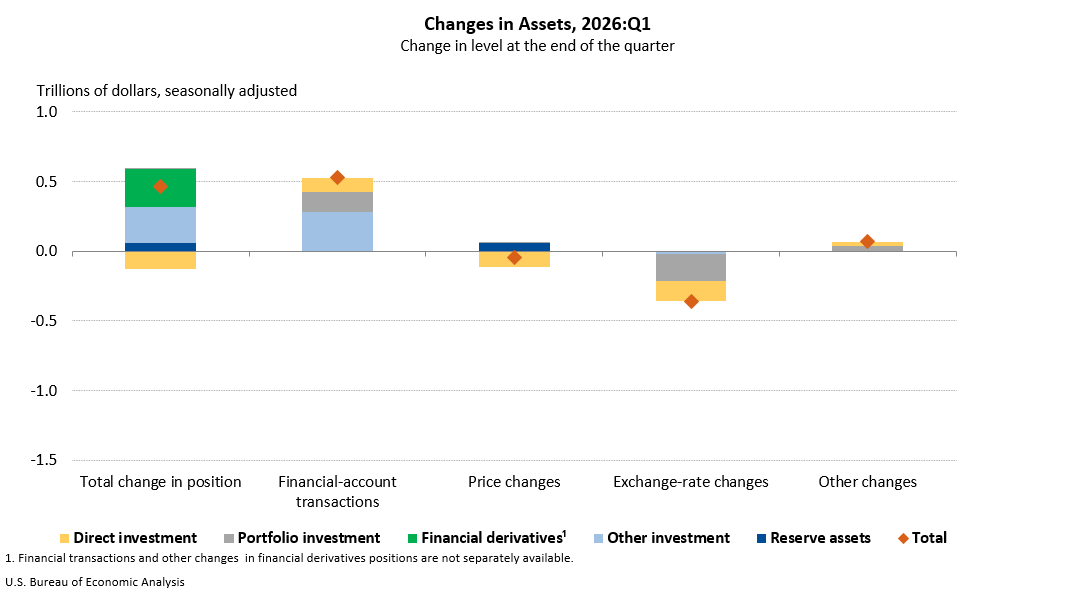
U.S. assets increased $462.9 billion in the first quarter, reflecting increases in all major investment categories except direct investment. Financial transactions of $527.3 billion were partly offset by exchange-rate changes of –$357.1 billion.
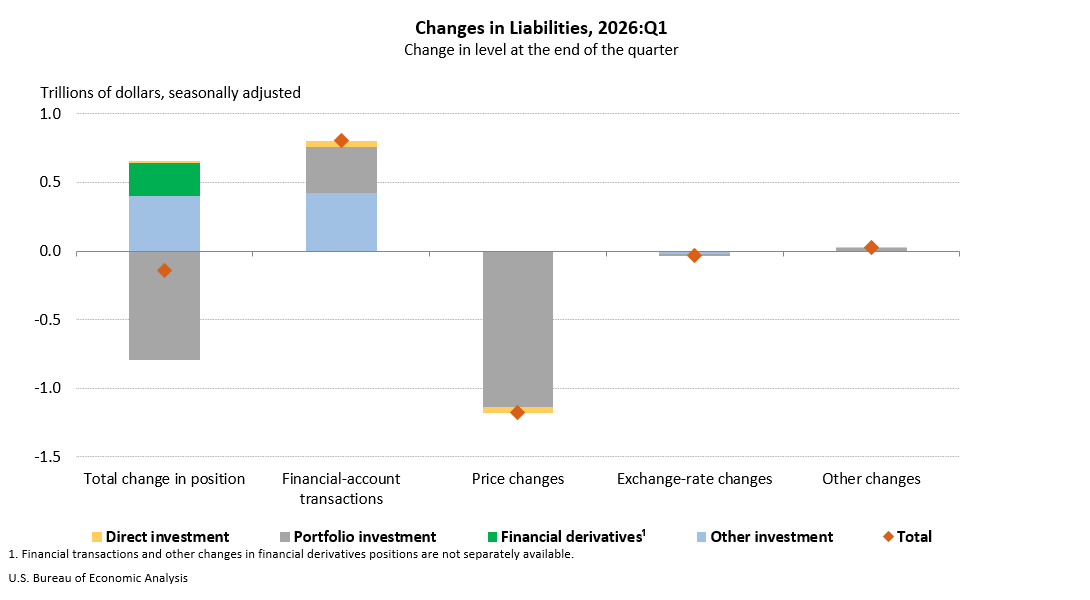
U.S. liabilities decreased $140.4 billion in the first quarter, reflecting a decrease in portfolio investment that was partly offset by increases in the other major investment categories. The overall decrease reflected price changes of –$1.18 trillion that were partly offset by financial transactions of $803.7 billion.
|
Updates for the Fourth Quarter of 2025 International Transactions Accounts Balances |
||
|---|---|---|
| Preliminary estimates | Revised estimates | |
| Billions of dollars, seasonally adjusted | ||
| Current-account balance | –190.7 | –221.1 |
| Goods balance | –241.5 | –259.4 |
| Services balance | 81.4 | 82.1 |
| Primary income balance | 23.9 | 3.4 |
| Secondary income balance | –54.6 | –47.2 |
| Net financial-account transactions | –135.9 | –248.7 |
| International Investment Position Aggregates | ||
|---|---|---|
| Preliminary estimates | Revised estimates | |
| Trillions of dollars, not seasonally adjusted | ||
| U.S. net international investment position | –27.54 | –21.87 |
| U.S. assets | 42.96 | 42.91 |
| U.S. liabilities | 70.49 | 64.78 |
| U.S. Bureau of Economic Analysis | ||
Annual Updates
The statistics in this release reflect the annual updates of the U.S. International Transactions Accounts (ITAs) and the International Investment Position (IIP) Accounts. With these updates, BEA has incorporated the following changes:
- Incorporated the results from BEA’s 2022 Benchmark Survey of Foreign Direct Investment in the United States and 2023 Benchmark Survey of Insurance Transactions by U.S. Companies with Foreign Persons.
- Incorporated improvements to the methodology for estimating transport services.
- Introduced newly available source data for U.S. financial-account transactions, positions, and income from the U.S. International Development Finance Corporation and implemented presentational changes in affected tables.
- Incorporated stock swaps into portfolio investment transactions.
- Discontinued direct investment-related adjustments to other investment loan positions and transactions.
- Incorporated market valuation of reserve asset securities.
- Incorporated improvements to the methodology for revaluing historical-cost foreign direct investment equity positions in the United States to market value.
BEA has also incorporated other newly available and revised source data, as well as recalculated seasonal and trading-day adjustments, beginning with statistics for 1999.
Newly Available and Revised Source Data: Key Providers and Years Affected
| Agency | Data | Years affected |
|---|---|---|
| BEA | Benchmark and quarterly insurance services surveys | 2019–2025 |
| Quarterly international services surveys | 2023–2025 | |
| Benchmark, annual, and quarterly direct investment surveys | 2022–2025 | |
| U.S. Census Bureau | Revised source data for Census-basis goods | 2023–2025 |
| U.S. Department of the Treasury | Annual portfolio investment surveys | 2024–2025 |
| Quarterly and monthly portfolio and other investment surveys | 2023–2025 | |
| U.S. Bureau of Economic Analysis | ||
More information on the annual updates is available in “Preview of the 2026 Annual Update of the International Economic Accounts” in the Survey of Current Business. Additional information will be provided in the Survey in July 2026. U.S. International Economic Accounts: Concepts and Methods will be updated in September 2026 accordingly.
Related Interactive Data Tables
For the first-quarter 2026 and annual update ITA and IIP statistics highlighted in this release, as well as historical time series for these estimates, see the below data tables in BEA’s Interactive Data Application.
International transactions
Table 1.1. U.S. International Transactions
Table 1.2. U.S. International Transactions, Expanded Detail
Table 2.1. U.S. International Trade in Goods
Table 3.1. U.S. International Trade in Services
Table 4.1. U.S. International Transactions in Primary Income
Table 5.1. U.S. International Transactions in Secondary Income
Table 6.1. U.S. International Financial Transactions for Direct Investment
Table 7.1. U.S. International Financial Transactions for Portfolio Investment
Table 8.1. U.S. International Financial Transactions for Other Investment
International investment position
Table 1.1. U.S. Net International Investment Position at the End of the Period
Table 1.2. U.S. Net International Investment Position at the End of the Period, Expanded Detail
Table 1.3. Change in the U.S. Net International Investment Position
Notes. With the release of second-quarter 2026 ITA and IIP statistics on September 24, 2026, the first-quarter data will be superseded, and the links above will reflect the latest data. The original data featured in this release can then be accessed in BEA’s Data Archive.
BEA has updated its disclosure avoidance method to coarsening, which includes rounding, aggregation, and the use of ranges. This allows BEA to publish more data, while still providing confidentiality to BEA’s survey respondents.
Next release: September 24, 2026, at 8:30 a.m. EDT
U.S. International Transactions and Investment Position, 2nd Quarter 2026