
Key Takeaways
- Tightening Spreads: The round lot change implemented in November 2025 clearly impacted spread outcomes. Both the $250 to $1,000 and $1,000 to $10,000 price categories saw sustained spread tightening from 21 days pre-reform to 21 days post reform — declining 27% and 23% respectively.
- Size at the Inside: Both the $250 to $1,000 and $1,000 to $10,000 price categories experienced sharp, persistent declines in average shares at the inside following the November 2025 change. From October to November 2025, shares dropped 29% from 209 to 148 shares and 68% from 99 to 32 shares respectively. Neither price group showed meaningful recovery through March 2026, signaling a lasting structural reduction in displayed depth for higher priced stocks.
- QDP Accuracy Improvement: QDP prediction accuracy improved across all price categories post-change, with the strongest gains concentrated in the higher priced segments, the $1,000 to $10,000 group and the $250 to $1,000 group. Both price categories were accompanied by simultaneous declines in false predictions and static predictions, pointing to a broad and meaningful lift in signal quality precisely where the reform had the greatest structural impact.
Round Lot Reform Details
As of November 3, 2025, the Securities and Exchange Commission (SEC) adopted amendments to certain rules of Regulation National Market System (Regulation NMS), one of which was introducing a new price-tiered round lot framework for NMS stocks. Under the new framework, round lot sizes are scaled to share price: 100 shares for stocks priced at or below $250, 40 shares for stocks priced between $250 and $1,000, 10 shares for stocks between $1,000 and $10,000 and one share for stocks priced above $10,000. By aligning round lot sizes with share price, the reform aimed to target that more quotes in high-priced securities would be subject to trade-through protections and best execution requirements, ultimately enhancing price discovery and quote competition across exchanges.
Impact on Spreads
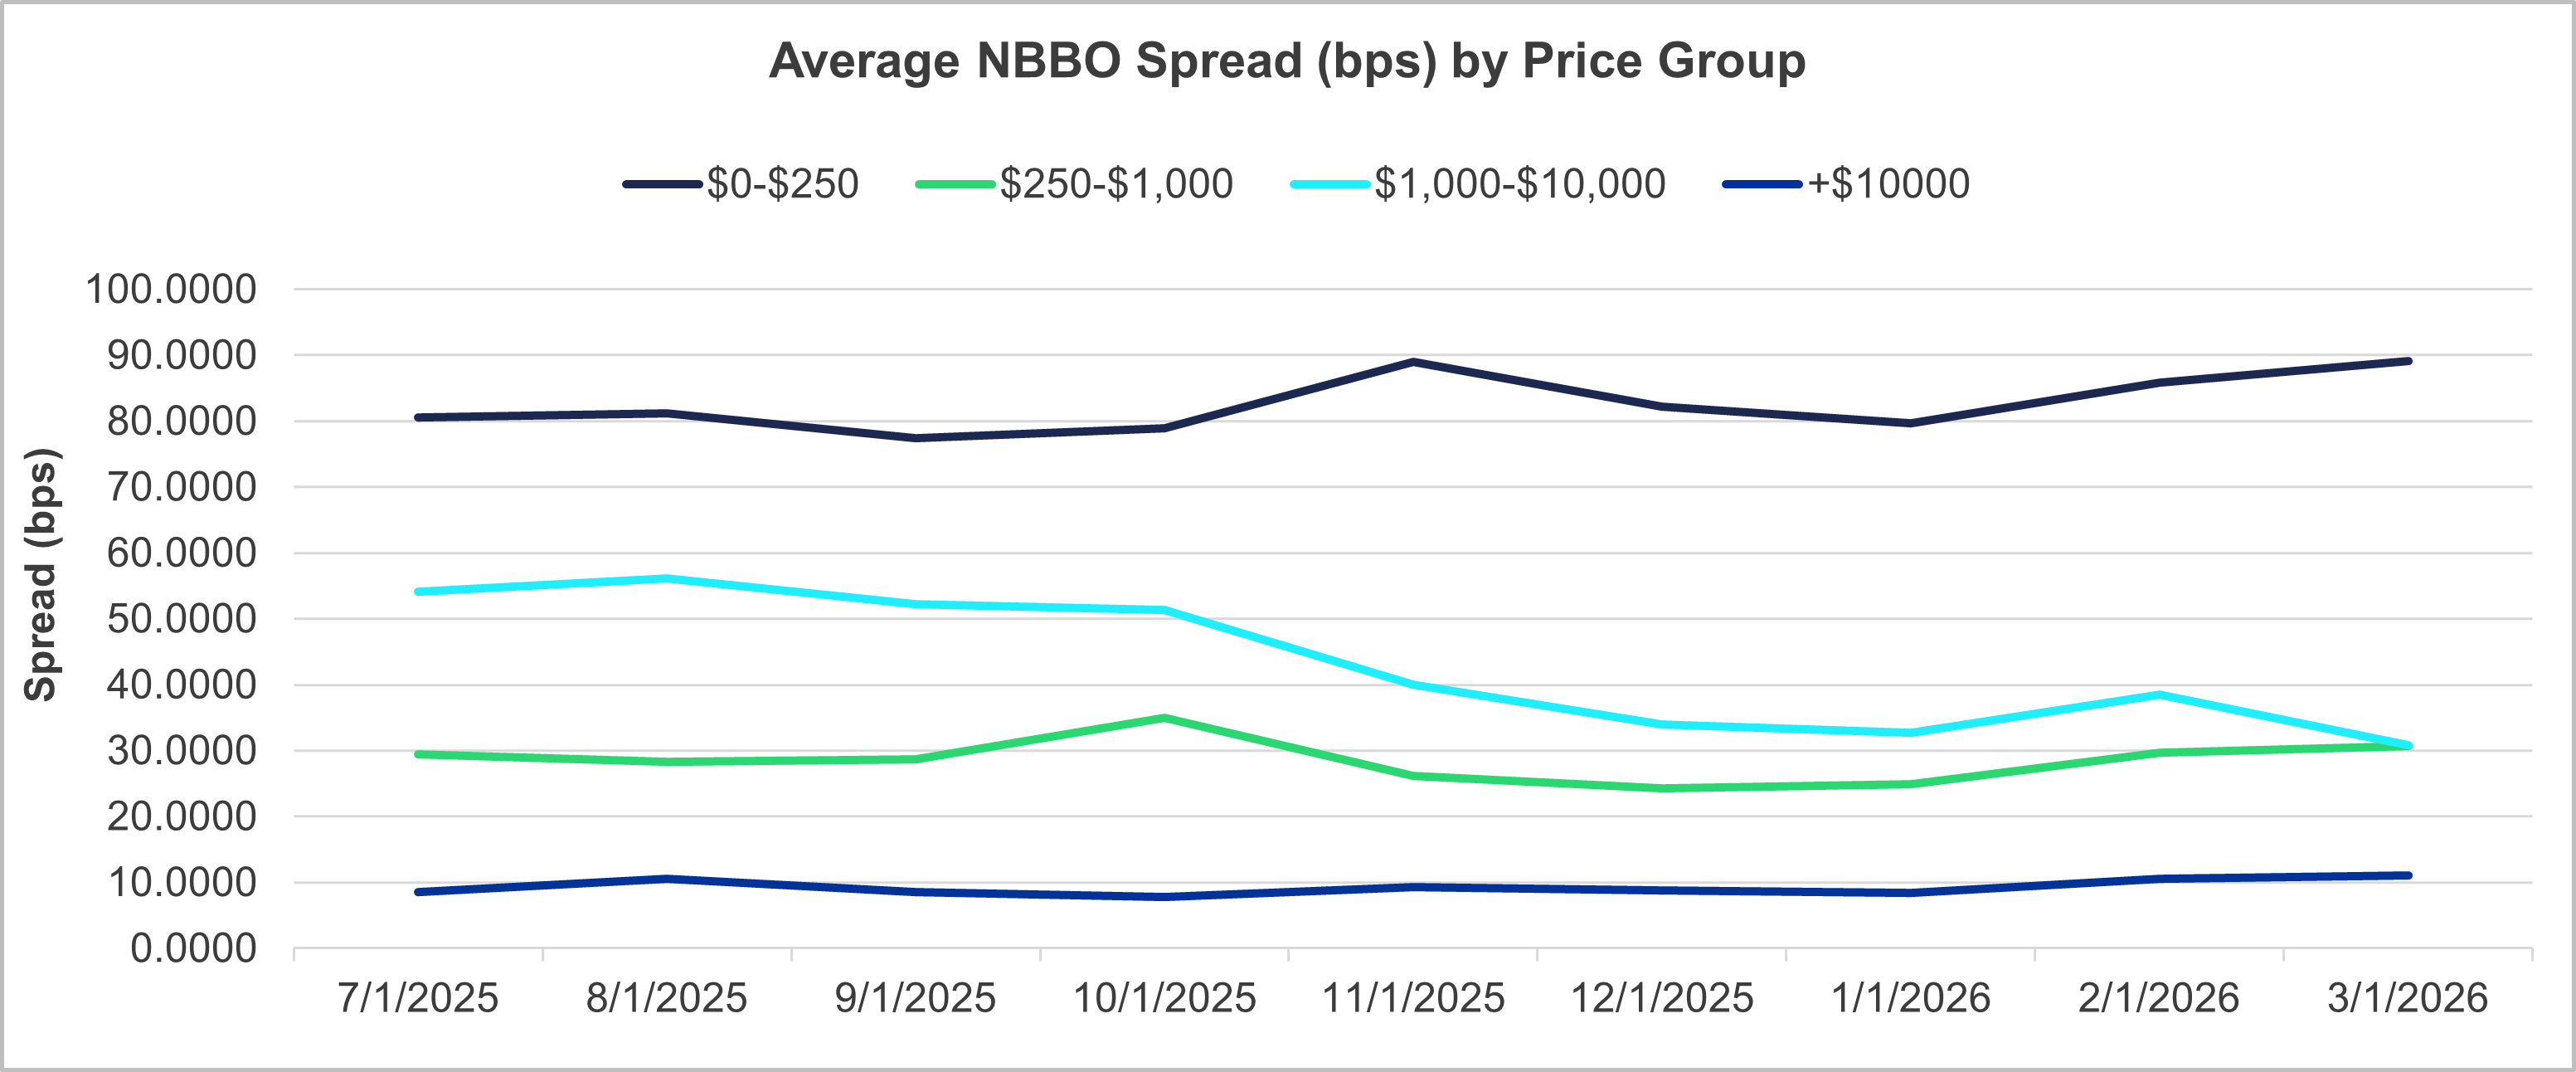
Figure 1: Average NBBO Spread by Price Group- Source: SIP Data
To examine the effects of the newly implemented round lot changes on spreads, we analyzed the average National Best Bid or Offer (NBBO) spread by price group both before and after the reform. The $0–$250 price group, which saw no change to its round lot size, consistently posted the widest spreads, averaging approximately 80 basis points (bps) prior to the reform and 85 bps after. The $10,000+ group remained the tightest, with an average spread of nine bps pre-reform and 10 bps post-reform. Together, these price groups illustrate a persistent inverse relationship between share price and spread width, and their relative stability post-reform provides a useful baseline against which the middle tiers can be compared.
The most notable changes occurred in the price groups directly affected by round lot reductions. The $1,000–$10,000 price group experienced meaningful structural compression, with spreads tightening approximately 34% from 53 bps pre-reform (July to October 2025) to around 35 bps post-reform (November 2025 to March 2026). This trend continued into March 2026, with spreads narrowing an additional 30% from November 2025 levels. The $250–$1,000 price group, whose round lot size was reduced to 40 shares, also saw spread tightening of approximately 11% from pre-reform to post-reform, consistent with improved quote competition and price discovery following the rule change.
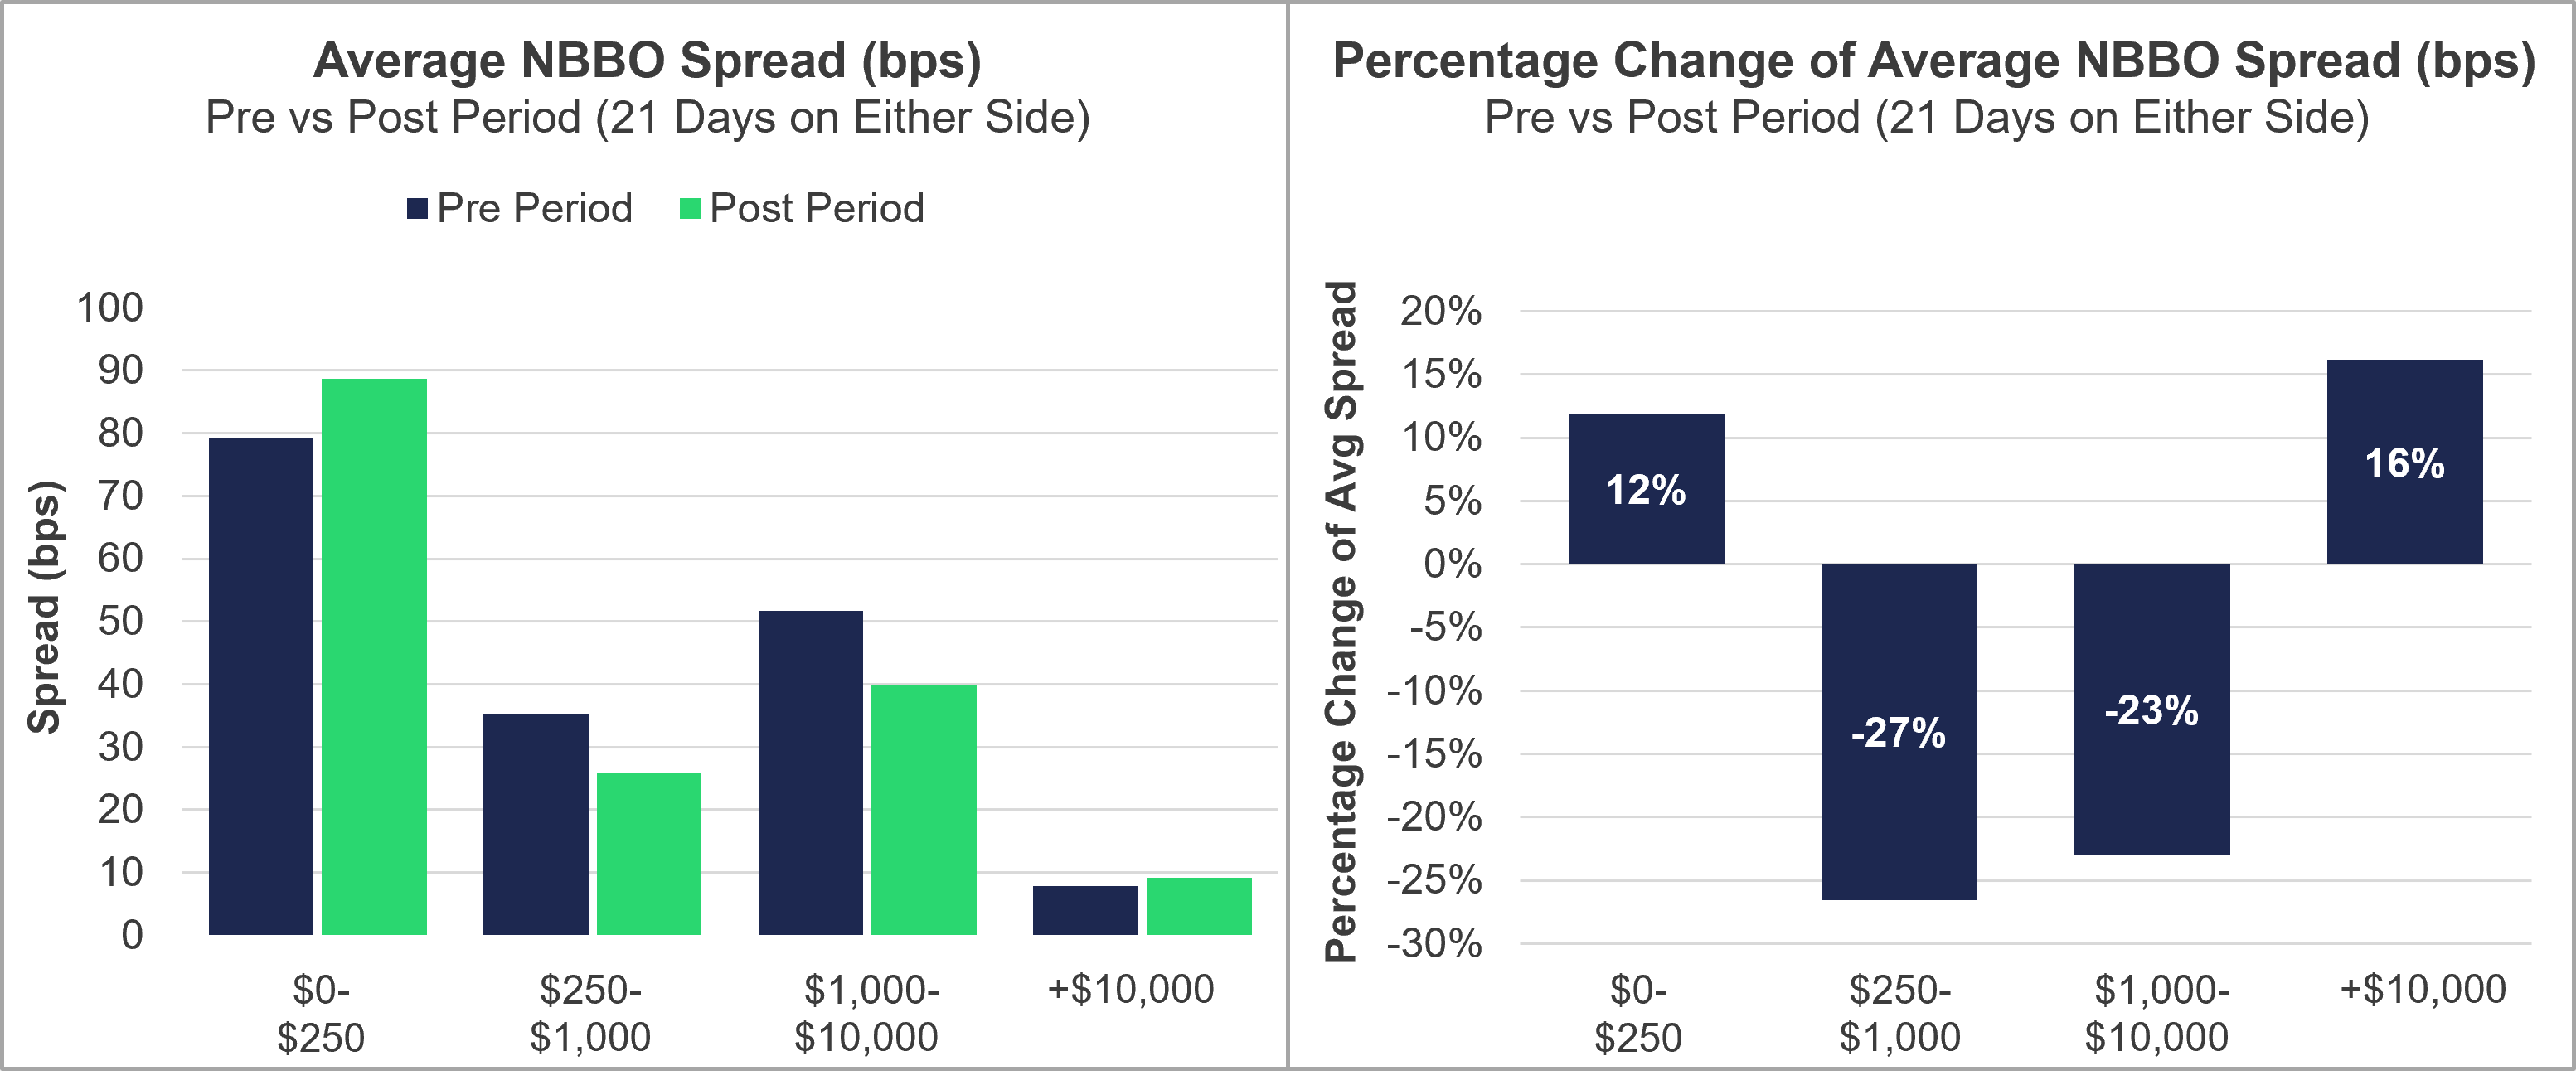
Figure 2: Average NBBO Spread Pre and Post – Source: SIP Data
In the 21 days prior to round lot implementation compared to the 21 days after, the NBBO widened in both the $0–$250 and $10,000+ price groups by 12% and 16%, respectively. On the other hand, the $250–$1,000 and $1,000–$10,000 price groups tightened meaningfully, suggesting the reform had different liquidity implications depending on price segment. The $1,000–$10,000 price group saw its spread tighten 23% while simultaneously experiencing a 68% collapse in inside size — suggesting that while quotes became more competitively priced post-reform, the depth behind those quotes thinned dramatically — a trade-off with meaningful implications for institutional execution quality.
The largest improvement was seen in the $250–$1,000 price group, which experienced 27% spread compression, dropping from approximately 35 bps to 26 bps. This improvement points to better execution quality for mid-priced stocks in the post-reform environment.
Impact of Change on Size at Inside
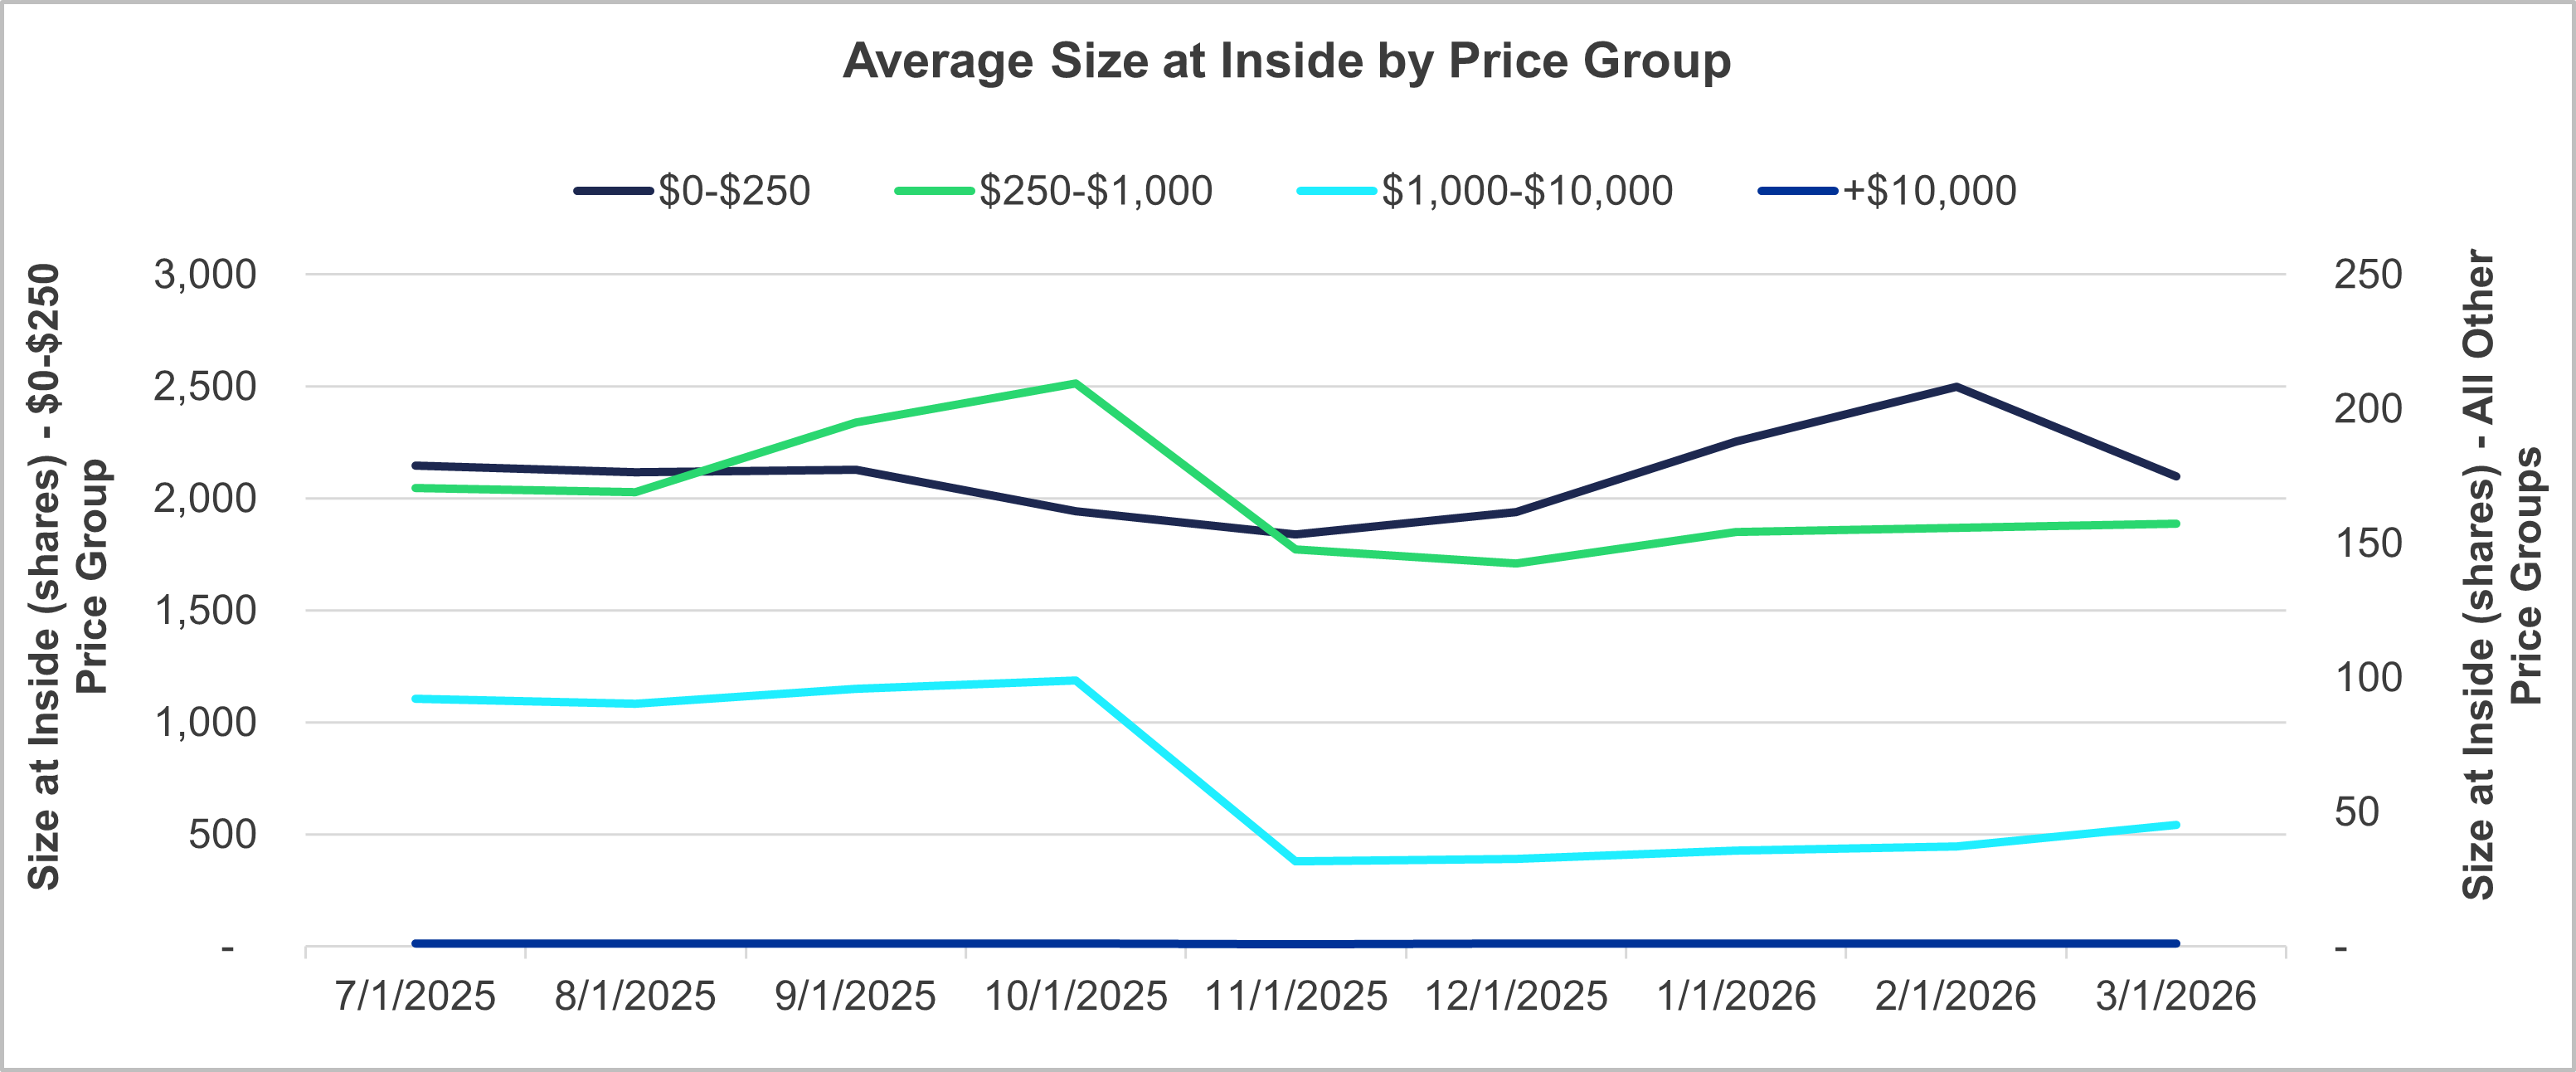
Figure 3: Average Size at the Inside by Price Group – Source: SIP Data
The chart above shows how round lot reform impacted the average size at the inside for each price group. Average inside size is stratified by price group, with $0–$250 stocks carrying around 1,800 to 2,500 shares at the inside compared to just one share for stocks priced $10,000 and above, reflecting the fundamental relationship between stock price and quoted lot size. Following the round lot changes implemented in November 2025, the $1,000–$10,000 price group saw the average inside size drop from approximately 99 shares in October to around 32 shares in November, a 68% decrease. This size has remained persistently low throughout 2026, marking the most substantial and sustained reform impact across all price groups.
The $250–$1,000 price group also experienced a notable decline, falling 29% in November 2025 from October 2025 levels, further suggesting the round lot reform constrained depth dynamics for higher-priced stocks. In contrast, the $0–$250 price group reflected the opposite trend, with inside size decreasing to around 1,840 shares in November 2025 before rebounding sharply to approximately 2,097 shares by March 2026, surpassing pre-reform levels.
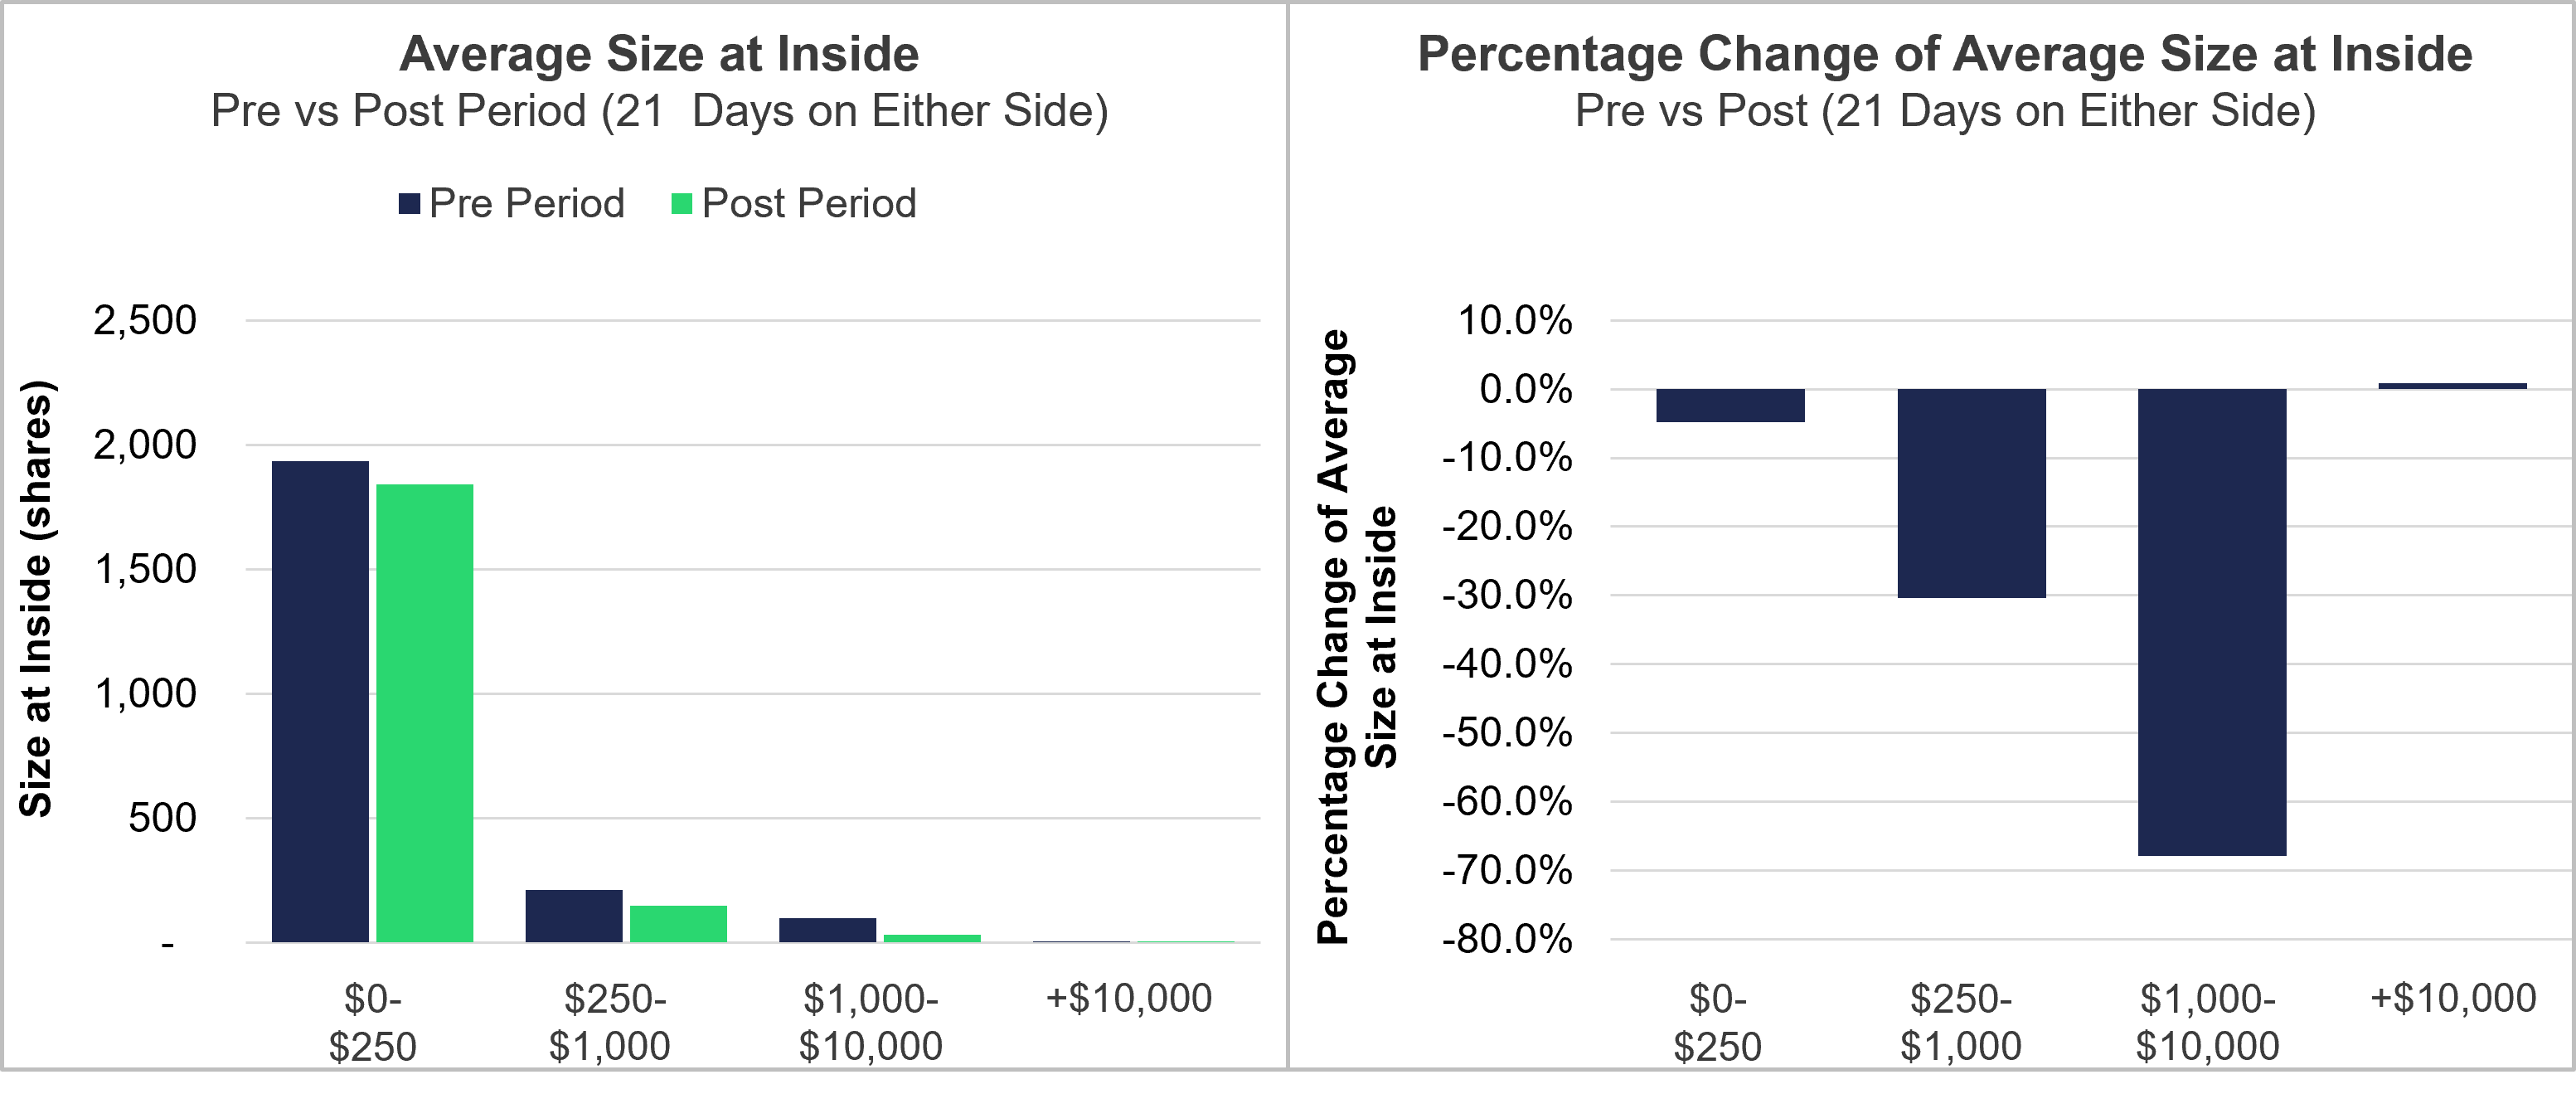
Figure 4: Average Size at the Inside Pre and Post Reform – Source: SIP Data
When analyzing the percentage change in the 21 days prior to round lot implementation compared to the 21 days post-implementation, a striking inverse relationship emerged between stock price and reform impact on inside size. Round lot reform disproportionately decreased liquidity in higher-priced names, as price groups between $250 and $10,000 saw reductions in their average inside size. The $1,000–$10,000 price group saw a 67.8% collapse in average shares at the inside, dropping from around 98 shares to 32, compared to only a 4.8% decline for the $0–$250 price group. This represents a loss of nearly two-thirds of liquidity for the $1,000–$10,000 price group, fundamentally altering the execution landscape for high-priced stocks. This trend extended to the $250–$1,000 price group, which also saw a substantial reduction of 30.3% in inside size, further emphasizing that the reform’s liquidity impact broadly affected names priced above $250. The $10,000+ price group is the sole exception, posting a marginal 0.8% increase post-reform. This suggests that at extreme price levels, quoted depth is so structurally thin — at around just one share — that the reform had virtually no measurable impact.
How Did This Affect Quote Depletion Protection?
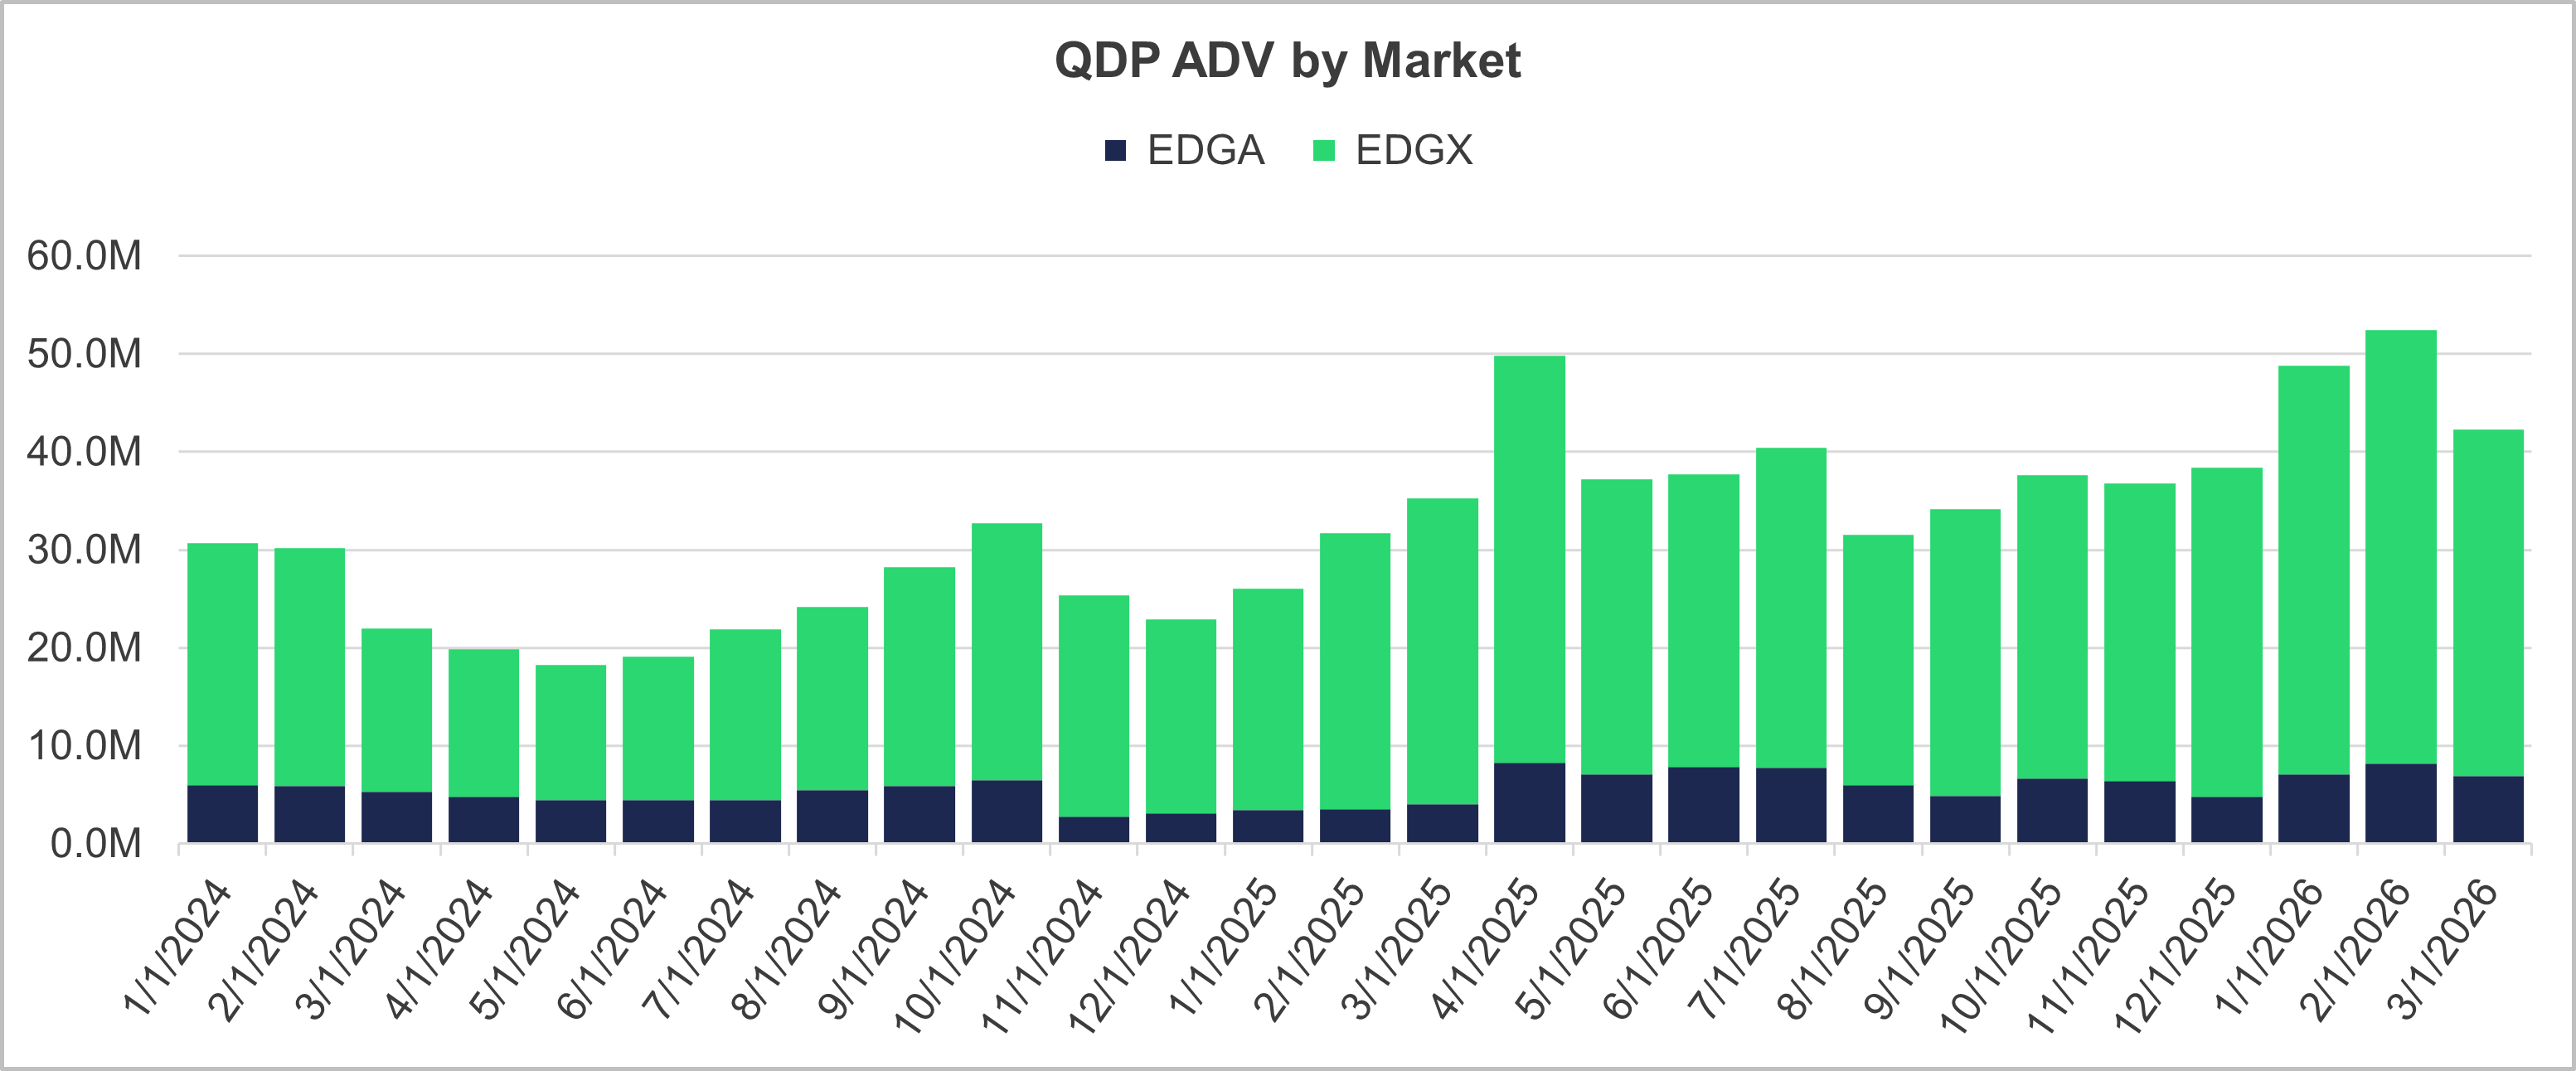
Figure 5: QDP ADV by Market – Source: Cboe Internal Data
After analyzing the impact of round lot changes on spreads, we looked at the effect on Cboe’s products and venues and further into Quote Depletion Protection (QDP), an optional instruction available on Midpoint Discretionary Orders (MDOs) on Cboe EDGA Equities Exchange (EDGA) and Cboe EDGX Equities Exchange (EDGX). QDP temporarily disables an MDO’s discretionary range when market conditions suggest the market may be moving against the resting order, protecting against adverse selection risk. Monitoring QDP trigger rates can help with understanding whether MDO orders are experiencing greater adverse selection pressure as a direct result of the reform and the impact on Cboe’s exchanges. The chart above breaks down QDP ADV by market to identify any meaningful changes in volume growth. Both EDGX and EDGA posted strong year-over-year volume growth from 2025 to 2026. EDGX ADV was 31.2 million between February and March 2025, growing 13% year-over-year to 35 million in February to March 2026. In that same period, EDGA grew from around four million to seven million, or approximately 71% year-over-year. EDGX accounts for approximately 82% of combined volume on average across the full dataset, consistently ranging between 75% and 89% month-to-month.
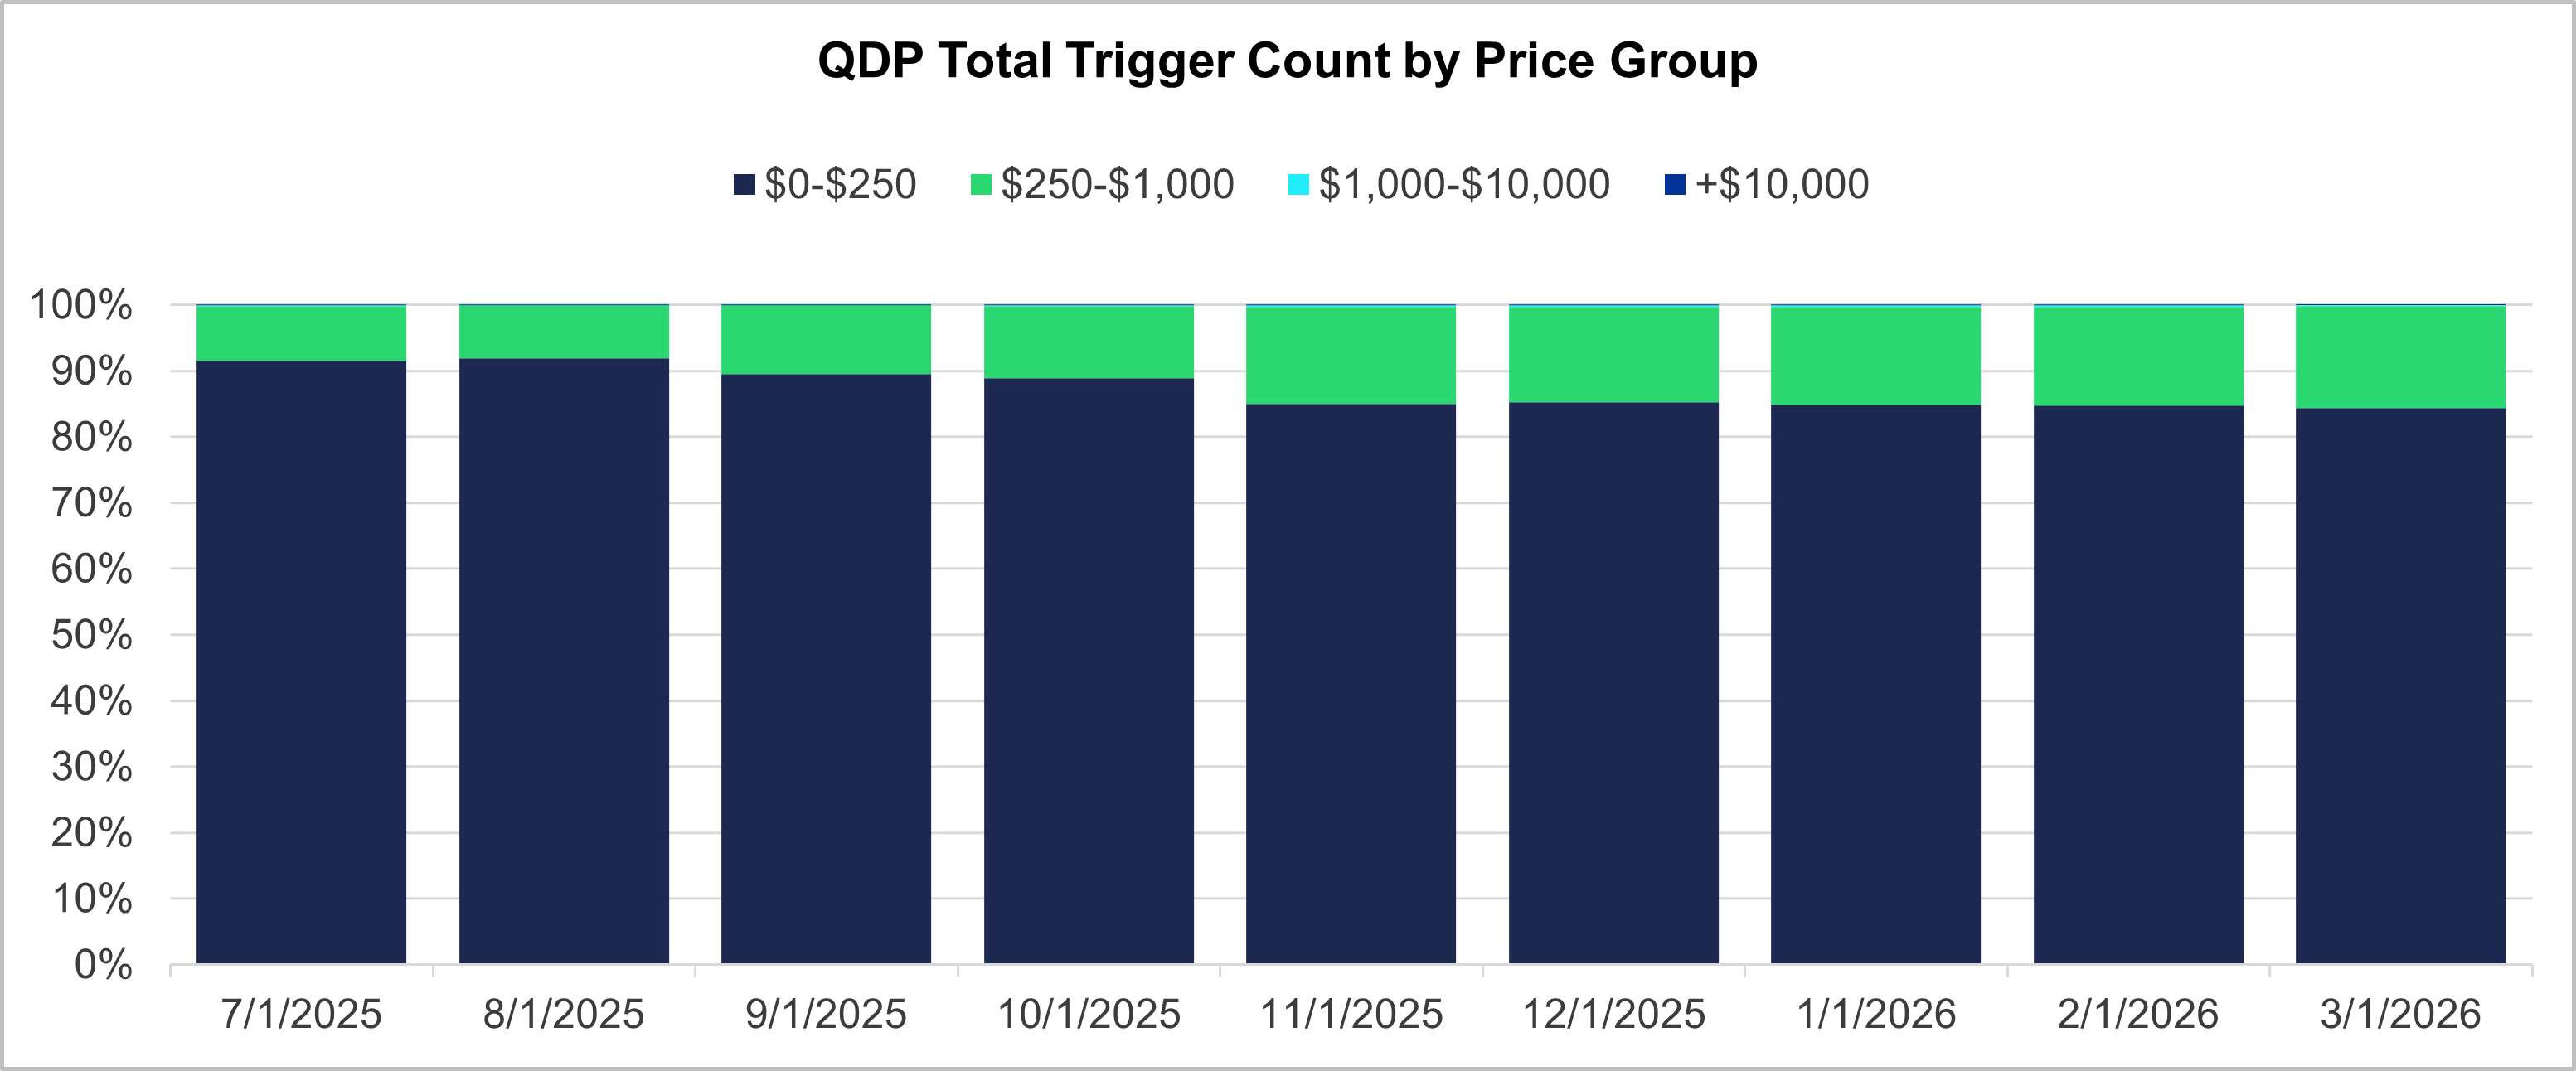
Figure 6: QDP Total Trigger Count by Price Group – Source: Cboe Internal Data
Additionally, measuring the QDP trigger count showed how often QDP is being invoked and whether the round lot reform is activating QDP protection more frequently. This resulted in trigger count shifts accelerating in November 2025 following the round lot reform. The $0–$250 price range shed only 3.1 percentage points of trigger share from July to October 2025, then dropped an additional 3.9 percentage points in November 2025, confirming the round lot change as the dominant catalyst rather than a gradual market evolution. The $250–$1,000 price group’s trigger share gain was front-loaded and immediate. Its share jumped from 11% in October 2025 to 14.7% in November 2025, a 3.7 percentage point single-month increase, before stabilizing in the 14.5%–15.3% range for four consecutive months through March 2026.
Overall, the round lot reform significantly altered QDP total trigger count distribution by price group. Higher-priced stocks experienced substantial shifts immediately following the reform, with the $250–$1,000 group seeing a rapid and sustained increase in trigger share while the $0–$250 group saw a notable decline. The trigger distribution has since stabilized at new levels across all price groups.
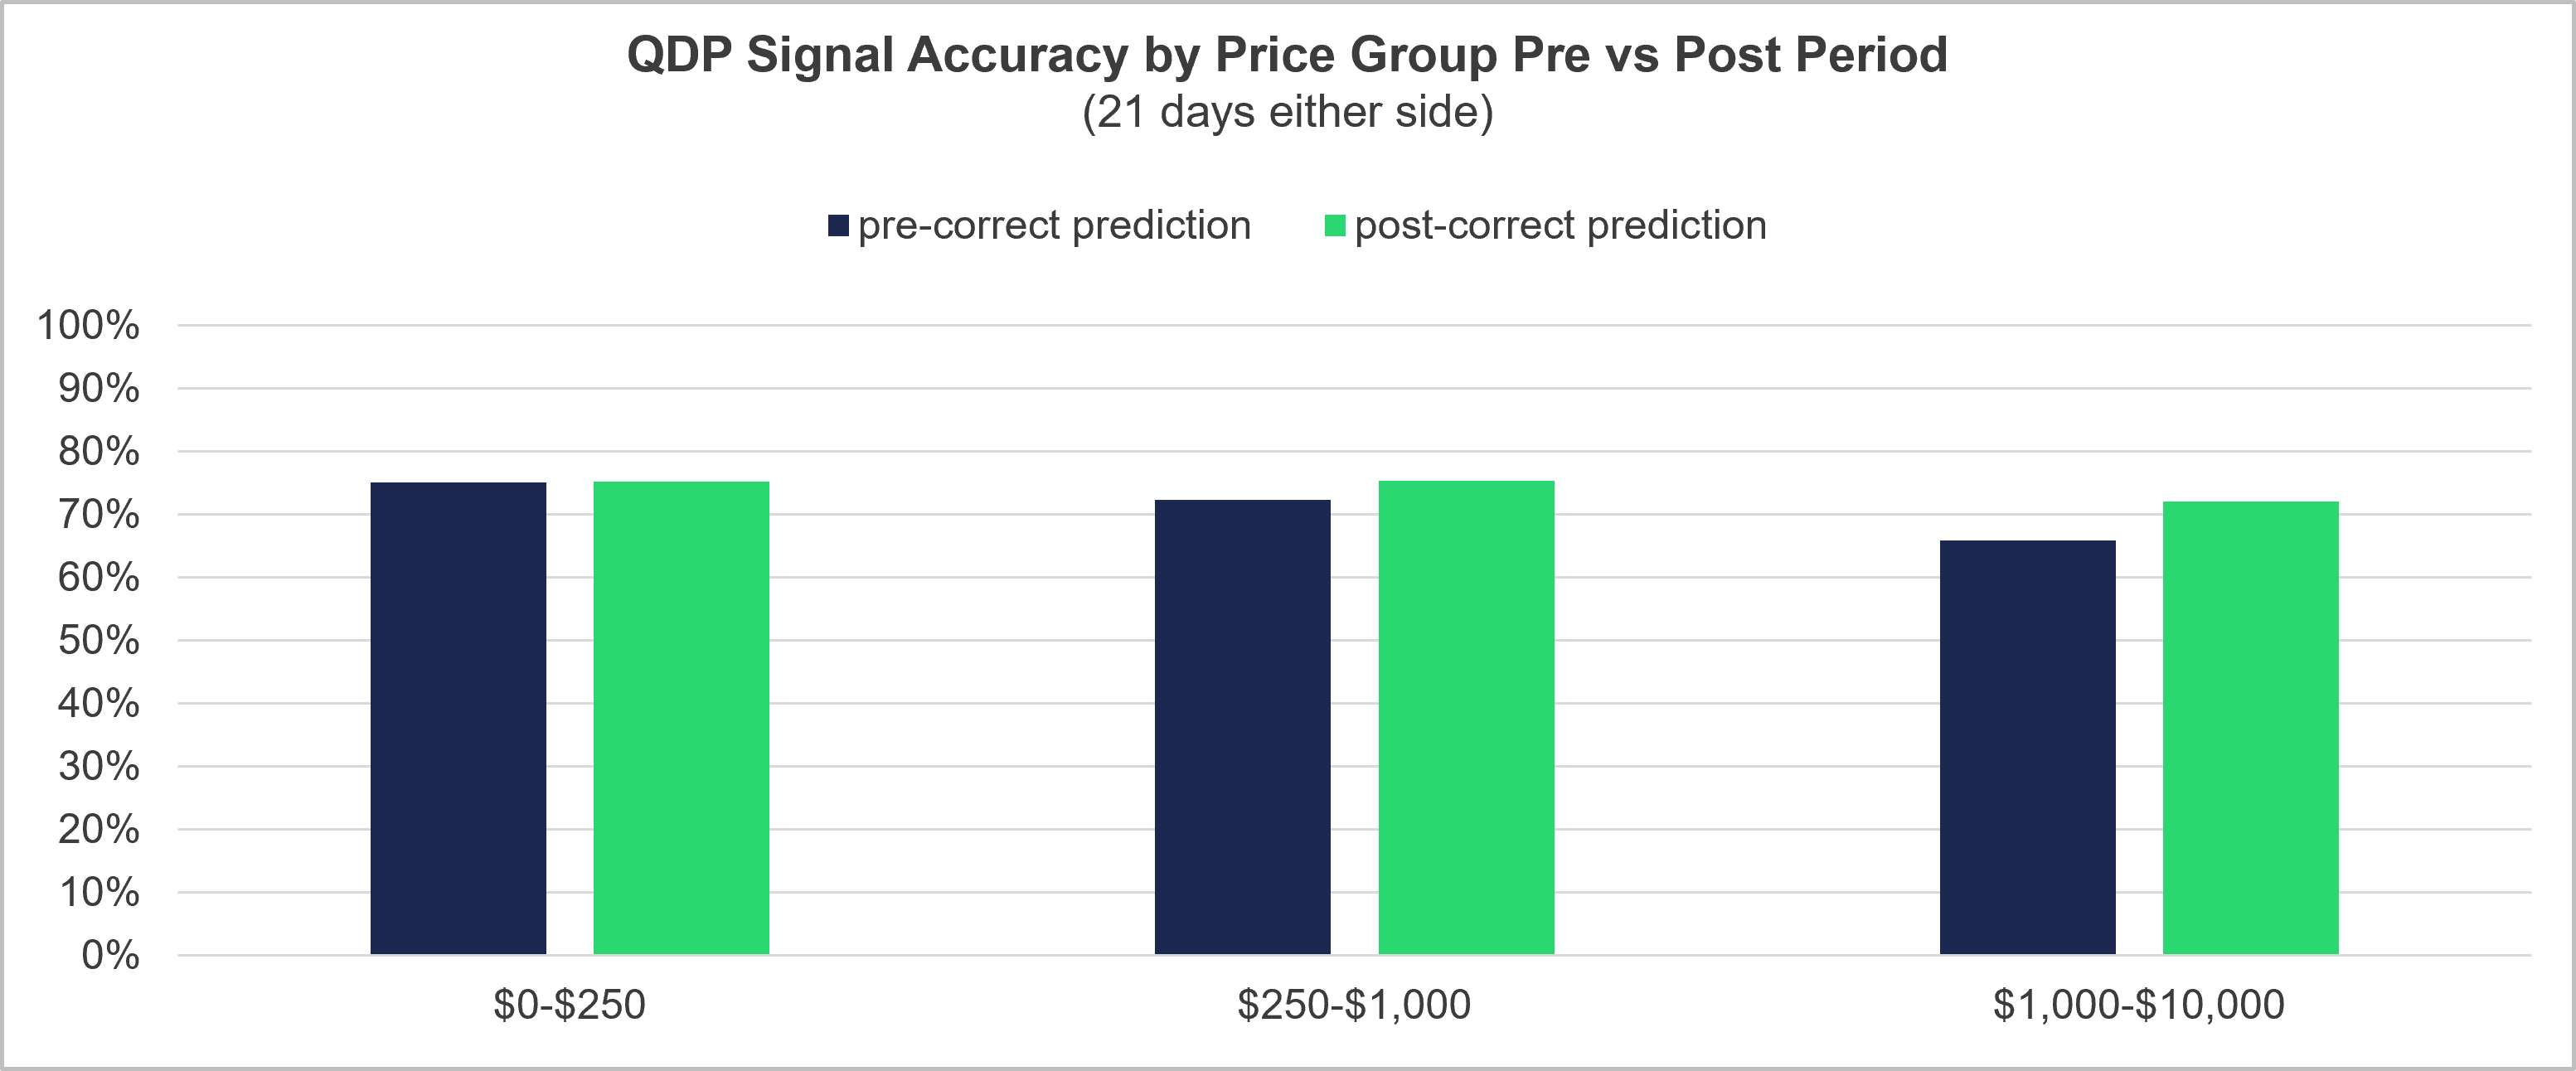
Figure 7: QDP Signal Accuracy by Price Group – Source: Cboe Internal Data
Additionally, round lot reform improved quote prediction accuracy in higher-priced stocks. The $1,000–$10,000 price group saw the largest accuracy gain when comparing the 21 days before and 21 days after the round lot change, rising from 65.9% to 72.1%, consistent with the hypothesis that odd-lot quotes in this price group were previously obscuring true NBBO informativeness. The round lot change also meaningfully reduced false prediction rates in the $1,000–$10,000 group, the most adversely selected price group, with false predictions dropping from 11.2% to 9.6%, a 14% relative reduction in quote misfires.
Post-reform, the accuracy gradient compressed significantly, with the three price groups converging toward a tighter 72.1% to 75.3% range, a compression of around three percentage points. This suggests the rule change structurally reduced the microstructure disadvantage faced by participants trading higher-priced securities.
The data suggests a rebalancing from static to correct predictions rather than from static to false. Across all price groups, the decline in static quotes post-reform was absorbed primarily by correct predictions rather than false ones, a favorable signal that the reform improved quote reliability rather than simply increasing noise.
Overall Impact on U.S. Equities Markets
The November 2025 round lot reform reshaped U.S. equities market structure in meaningful and measurable ways. Across spread dynamics, displayed depth and quote protection behavior, the reform had its most significant impact on higher-priced stocks, precisely where the structural changes were most pronounced.
Spreads tightened where the reform introduced smaller round lot sizes, with the $1,000–$10,000 and $250–$1,000 price groups seeing the clearest post-reform compression. However, this improvement came with a trade-off, as liquidity in those same segments declined sharply and has not recovered, signaling a lasting structural reduction in depth for higher-priced names. The $0–$250 group, which saw no change to its round lot size, remained broadly stable and even surpassed pre-reform depth levels by March 2026.
For EDGX and EDGA venues, the reform’s effects were visible in QDP behavior. Trigger counts shifted immediately in November 2025 and stabilized at new levels, while QDP signal accuracy improved across all price groups, most notably in the $1,000–$10,000 segment, where reduced round lot sizes brought quote informativeness more in line with the broader market. The convergence in accuracy across price groups post-reform further suggests the rule change structurally reduced the microstructure disadvantage faced by participants trading higher-priced securities.
Taken together, the round lot reform delivered on its core objectives: tighter spreads, improved price discovery and more reliable quote signals. The reduction in displayed depth for higher-priced stocks is a notable structural trade-off that market participants, particularly institutional traders, should account for in their execution strategies going forward.
There are important risks associated with transacting in any of the Cboe Company products discussed here. Before engaging in any transactions in those products, it is important for market participants to carefully review the disclosures and disclaimers contained at: These products are complex and are suitable only for sophisticated market participants. In certain jurisdictions, Cboe Company products are only permitted for investment professionals, certified sophisticated investors, or high net worth corporations and associations. These products involve the risk of loss, which can be substantial and, depending on the type of product, can exceed the amount of money deposited in establishing the position. Market participants should put at risk only funds that they can afford to lose without affecting their lifestyle. © 2026 Cboe Exchange, Inc. All Rights Reserved.