
- Luxury home prices rose 4.6% in December—more than triple the gain in non luxury prices. Only two major metro areas saw declines.
- Redfin agents say a lack of quality inventory is propping up prices; the supply of luxury homes for sale posted the slowest growth since April.
- Pending sales of luxury homes fell 1.1%—the biggest drop since June—compared with a 0.6% decline in non luxury sales.
The median luxury home sale price in America rose 4.6% year over year to $1.31 million in December. By comparison, non luxury prices rose 1.4% to $375,000—the slowest growth in records dating back to 2013.
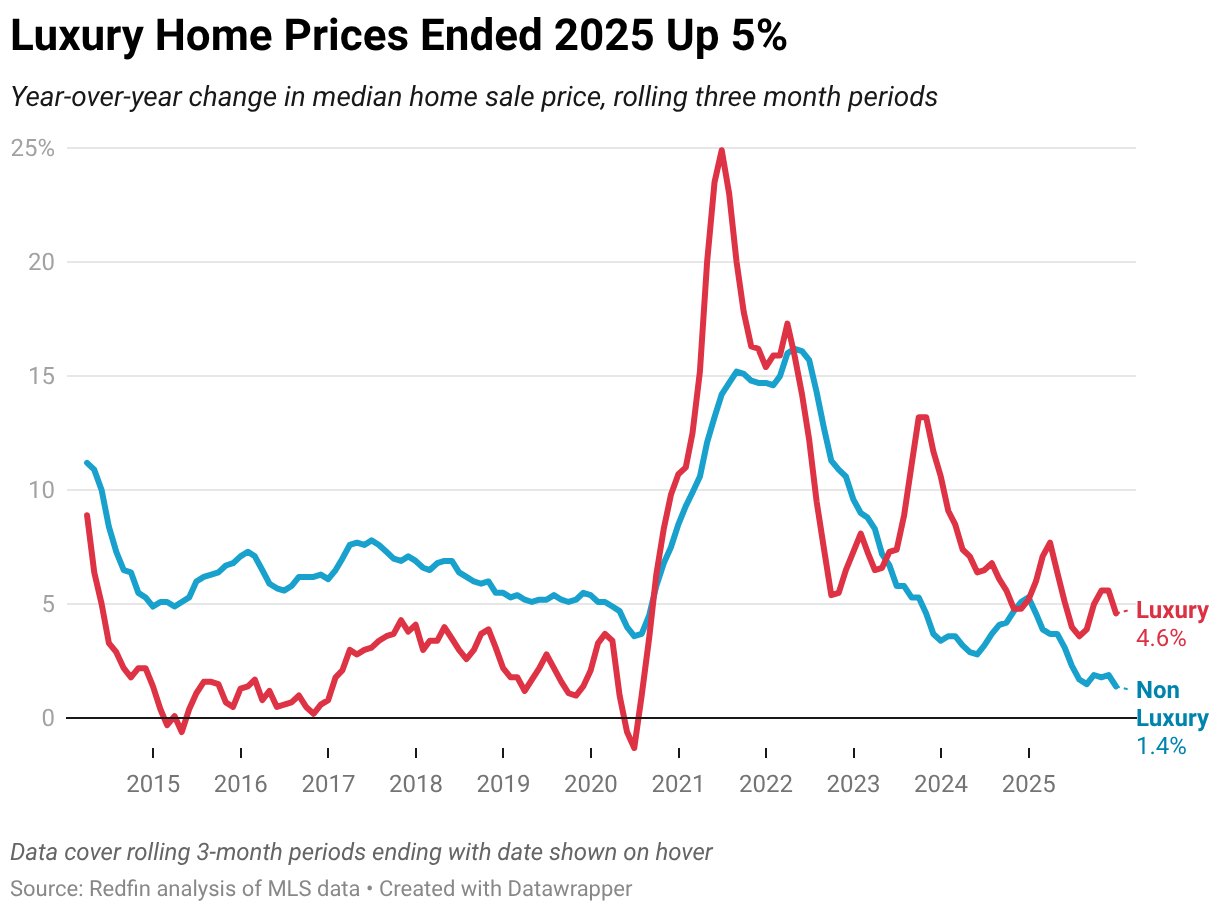
Luxury home prices fell in just two metros: Fort Worth, TX and Portland, OR.
This is based on a Redfin analysis of MLS home sales from October through December 2025, which we refer to as “December” throughout this report. All figures in this report cover rolling three-month periods, the most recent of which lines up with the fourth quarter. Redfin defines luxury homes as those estimated to be in the top 5% of their metro area’s price range, while non-luxury homes fall into the 35th–65th percentile. These data are subject to revision.
Luxury home prices are rising not because demand is high, but because affluent buyers are competing over the few homes on the market that everyone wants, said Alin Glogovicean, a Redfin Premier real estate agent in Los Angeles.
“Homebuyers are very selective because prices and mortgage rates are high—they want a house that has everything. Even super wealthy buyers are hesitant to pull the trigger because there’s not a lot of great inventory and they don’t want to settle,” Glogovicean said. “We’re seeing bidding wars on the few homes that are desirable, which is driving up prices. If you list your house for $2.9 million and it’s in really good shape and in a desirable location, you might sell it for $3.3 million and get a buyer who pays cash and waives contingencies.”
Luxury Pending Sales Posted the Biggest Decline in Six Months
Pending sales of luxury homes fell 1.1% year over year in December—the biggest decline in six months. By comparison, pending sales of non luxury homes fell 0.6%, the largest decline in eight months.
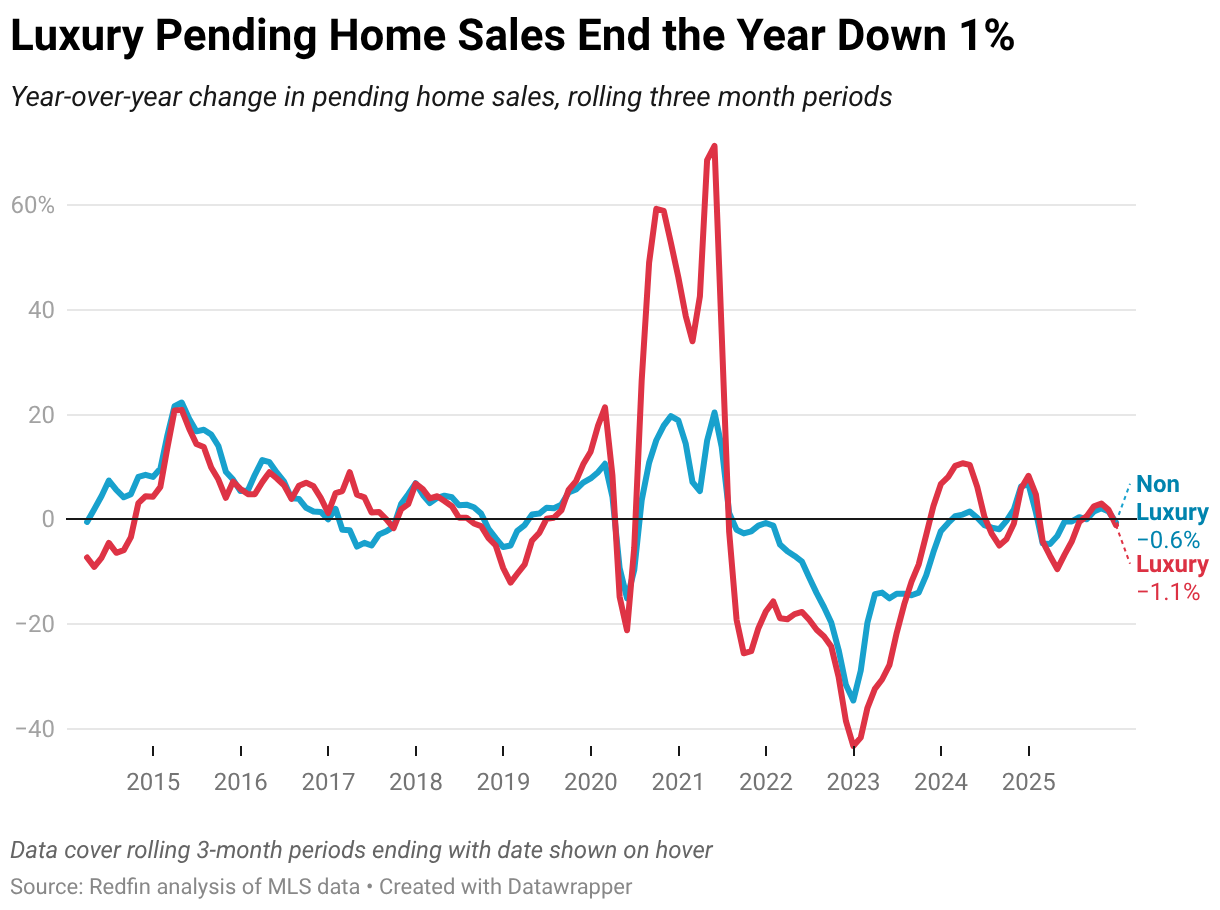
Closed sales of luxury U.S. homes—a more backward looking metric—rose 0.4% year over year. That compares with a 0.7% decrease for non luxury homes.
Luxury Housing Supply Rose 6%—the Slowest Growth Since April
Active listings of luxury homes for sale increased 5.6% year over year in December—the slowest growth since April. Non luxury listings rose faster—7%—though that was the slowest growth since February 2024. Supply growth is likely slowing because homebuyer demand is sluggish.
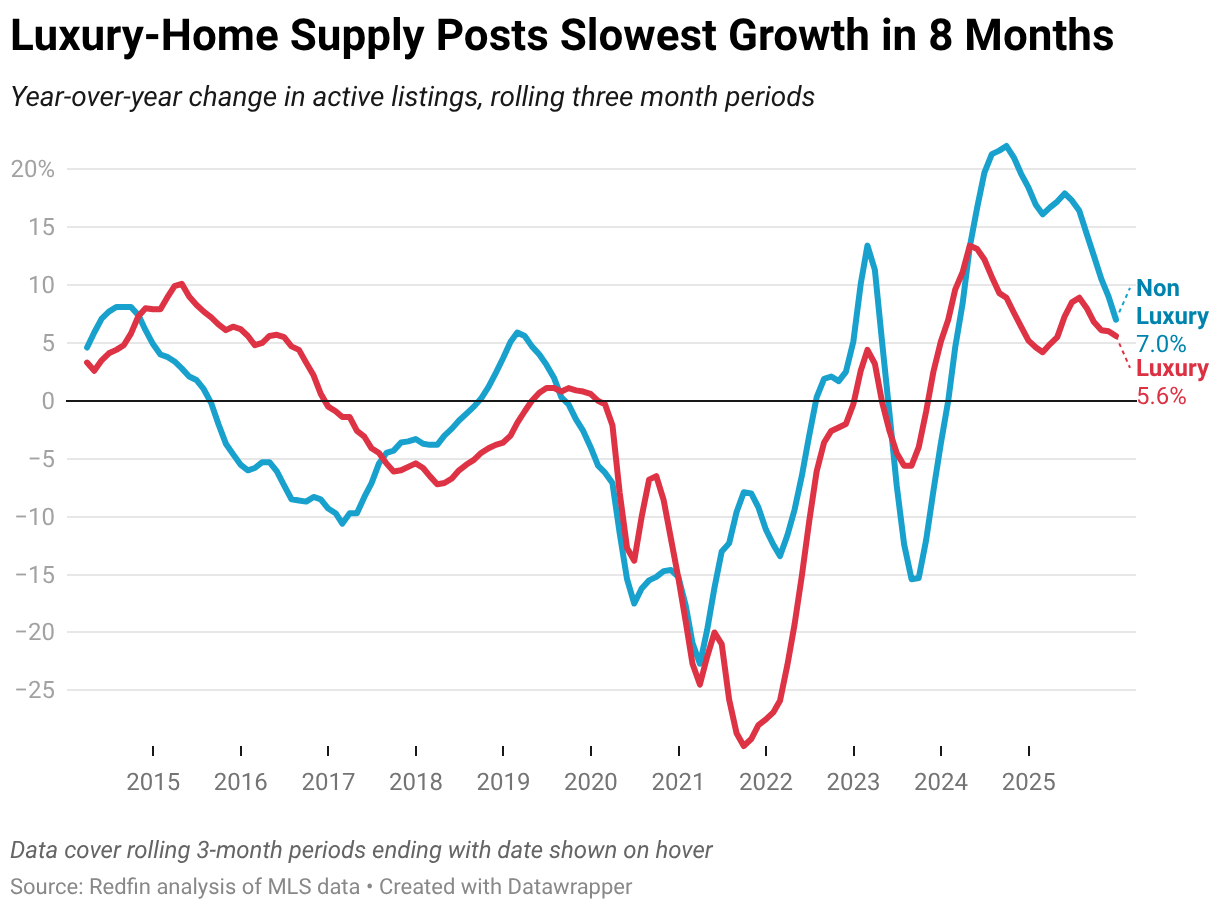
New listings of luxury homes climbed 2.9%, compared with a 2.4% decline in non luxury new listings.
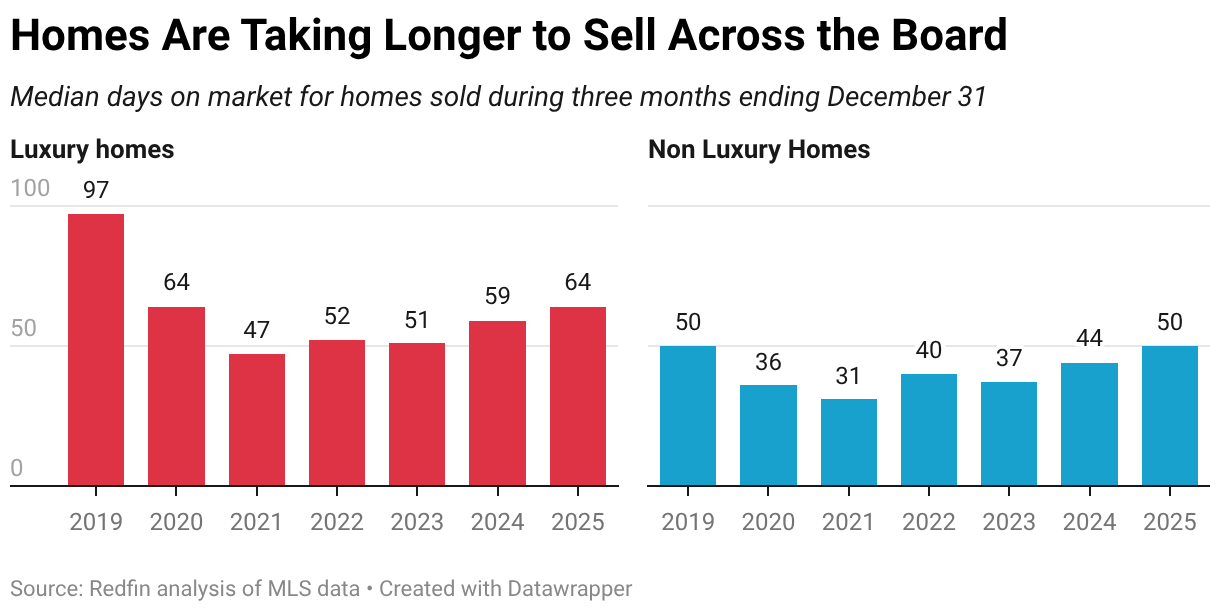
The Typical Luxury Home Took 64 Days to Sell—Five Days Slower Than a Year Earlier
The typical luxury home that went under contract in December took 64 days to do so, up five days from a year earlier and the slowest December pace since 2020. Meanwhile, the typical non luxury home took 50 days to go under contract, up six days from a year earlier and the slowest December pace since 2019.
Metro-Level Luxury Highlights: December 2025
Redfin’s metro-level luxury data includes the 50 most populous U.S. metros. All changes below are year over year.
- Prices: Luxury prices rose most in Milwaukee (20.6%), Orlando, FL (16.8%) and Nashville (13.6%). They fell in just two metros: Fort Worth, TX (-1.9%) and Portland, OR (-0.7%).
- Pending Sales: Luxury pending sales rose most in West Palm Beach, FL (28.6%), San Francisco (16.1%) and Tampa, FL (12%). They fell most in San Jose, CA (-35%), Philadelphia (-20.5%) and New Brunswick, NJ (-19.1%).
- Active Listings: Luxury active listings rose most in Tampa (40.6%), Detroit (19.2%) and Nashville (17.7%). They fell most in San Jose (-27.4%), Philadelphia (-16.1%) and Milwaukee (-14.9%).
- New Listings: Luxury new listings rose most in Detroit (29.4%), Kansas City, MO (22.4%) and Tampa (22.1%). They fell most in Milwaukee (-25.7%), New York (-19%) and Warren, MI (-13.9%).
- Speed of Sales: Luxury homes sold fastest in San Jose (13 days), Oakland (16 days) and St. Louis (23 days). They sold slowest in Miami (142 days), Fort Lauderdale, FL (133 days) and West Palm Beach (112 days).
Full Metro-Level Luxury Data: December 2025
The table below includes the 50 most populous U.S. metropolitan areas. Luxury homes are defined as those estimated to be in the top 5% of their respective metro area based on prices of homes sold over a rolling 12-month period.
| U.S. Metro Area | Median Sale Price | Median Sale Price YoY | Pending Sales YoY | Homes Sold YoY | Active Listings YoY | New Listings YoY | Median Days On Market | Median Days On Market YoY |
|---|---|---|---|---|---|---|---|---|
| Anaheim, CA | $4,970,824 | 6.9% | 7.8% | 9.2% | -8.3% | -7.3% | 84 | 1 |
| Atlanta, GA | $1,425,367 | 6.7% | -4.1% | -3.1% | 16.7% | 15.7% | 61 | -3 |
| Austin, TX | $1,785,805 | 6.8% | 1.9% | -2.5% | -6.9% | -0.7% | 94 | -20 |
| Baltimore, MD | $1,291,268 | 7.4% | 0.6% | 1.2% | 10.1% | -4.4% | 50 | 10 |
| Boston, MA | $2,830,475 | 11.4% | -1.8% | -4.3% | 2.0% | -4.2% | 45 | 2 |
| Charlotte, NC | $1,616,709 | 4.8% | -4.8% | 0.7% | 11.7% | 3.3% | 69 | 11 |
| Chicago, IL | $1,507,253 | 5.1% | -4.8% | 2.1% | -13.9% | -3.3% | 64 | -11 |
| Cincinnati, OH | $958,412 | 9.2% | -11.1% | 1.0% | -0.8% | -3.3% | 69 | 14 |
| Cleveland, OH | $809,816 | 1.7% | 3.6% | 16.8% | -1.7% | -9.6% | 43 | 4 |
| Columbus, OH | $978,597 | 4.6% | 7.0% | 15.5% | 15.2% | 18.1% | 51 | -6 |
| Dallas, TX | $1,697,043 | 8.4% | -9.8% | -14.2% | 9.3% | -3.8% | 63 | 15 |
| Denver, CO | $1,986,431 | 4.2% | -5.9% | -7.3% | 4.0% | 3.9% | 44 | -6 |
| Detroit, MI | $712,069 | 3.2% | -5.6% | -15.5% | 19.2% | 29.4% | 25 | -5 |
| Fort Lauderdale, FL | $2,161,965 | 5.8% | 4.8% | 7.5% | 4.4% | 9.6% | 133 | 14 |
| Fort Worth, TX | $1,198,141 | -1.9% | -6.2% | -7.5% | 10.0% | -2.3% | 66 | -3 |
| Houston, TX | $1,351,764 | 3.4% | 11.3% | -2.9% | 4.0% | -3.1% | 51 | 11 |
| Indianapolis, IN | $994,379 | 10.2% | -2.1% | -0.2% | 4.0% | -10.1% | 37 | 12 |
| Jacksonville, FL | $1,522,335 | 3.0% | 2.0% | -2.3% | -6.0% | -9.2% | 99 | 16 |
| Kansas City, MO | $1,098,578 | 12.1% | -4.8% | 8.3% | -1.6% | 22.4% | 38 | -25 |
| Las Vegas, NV | $1,603,258 | 8.1% | -0.2% | -3.1% | 11.7% | 1.5% | 84 | 12 |
| Los Angeles, CA | $4,386,126 | 7.2% | -1.9% | -4.9% | -1.0% | 0.1% | 77 | -1 |
| Miami, FL | $4,364,183 | 8.2% | 6.9% | 8.7% | -9.3% | -8.0% | 142 | -1 |
| Milwaukee, WI | $1,166,608 | 20.6% | -4.2% | -10.3% | -14.9% | -25.7% | 68 | 8 |
| Minneapolis, MN | $1,209,856 | 2.4% | -11.5% | 7.5% | -1.0% | -4.5% | 45 | -10 |
| Montgomery County, PA | $1,579,889 | 4.6% | -3.1% | 1.6% | -0.5% | 1.7% | 41 | -6 |
| Nashville, TN | $2,239,870 | 13.6% | 9.0% | 10.2% | 17.7% | 6.9% | 99 | -1 |
| Nassau County, NY | $2,718,532 | 8.5% | -3.5% | -3.3% | -8.1% | -7.6% | 79 | 8 |
| New Brunswick, NJ | $2,075,856 | 10.0% | -19.1% | -5.0% | -7.8% | 7.9% | 49 | 8 |
| New York, NY | $4,188,324 | 8.1% | -10.1% | -8.9% | -5.0% | -19.0% | 107 | 40 |
| Newark, NJ | $1,989,466 | 3.7% | -6.4% | 12.9% | -10.9% | 4.1% | 30 | 8 |
| Oakland, CA | $3,122,604 | 6.9% | -1.1% | 14.9% | -3.2% | -1.9% | 16 | -1 |
| Orlando, FL | $1,521,909 | 16.8% | -5.0% | -1.1% | -3.5% | -0.3% | 68 | 10 |
| Philadelphia, PA | $1,312,992 | 10.9% | -20.5% | -12.9% | -16.1% | -7.5% | 52 | 0 |
| Phoenix, AZ | $2,100,012 | 10.1% | 5.7% | 10.5% | 8.0% | 13.9% | 67 | 2 |
| Pittsburgh, PA | $901,094 | 3.1% | 3.8% | 3.1% | 2.5% | 7.5% | 78 | 10 |
| Portland, OR | $1,420,782 | -0.7% | -3.1% | 0.9% | 10.6% | 2.4% | 69 | 7 |
| Providence, RI | $1,590,833 | 1.4% | -15.1% | -11.8% | 3.8% | 1.1% | 50 | 2 |
| Riverside, CA | $1,715,267 | 7.0% | 3.7% | 5.3% | -3.5% | -3.6% | 66 | 7 |
| Sacramento, CA | $1,735,923 | 2.8% | -11.1% | -10.5% | 0.8% | -8.9% | 63 | 9 |
| San Antonio, TX | $956,362 | 5.1% | -11.6% | -11.1% | 7.0% | -5.3% | 109 | 13 |
| San Diego, CA | $3,849,731 | 4.1% | 1.7% | 3.0% | 5.2% | 6.8% | 66 | 11 |
| San Francisco, CA | $7,166,667 | 10.0% | 16.1% | 24.1% | -13.7% | 2.0% | 30 | 10 |
| San Jose, CA | $5,630,388 | 12.8% | -35.0% | -24.5% | -27.4% | -10.4% | 13 | -3 |
| Seattle, WA | $3,092,655 | 2.8% | -15.5% | -2.5% | 7.0% | -13.7% | 25 | 10 |
| St. Louis, MO | $967,842 | 3.5% | -6.4% | 5.5% | 5.1% | 13.4% | 23 | -6 |
| Tampa, FL | $1,447,541 | 0.9% | 12.0% | 22.9% | 40.6% | 21.1% | 54 | 4 |
| Virginia Beach, VA | $1,076,375 | 4.8% | 11.4% | 16.6% | 4.4% | -2.1% | 54 | 15 |
| Warren, MI | $1,082,003 | 11.3% | -9.1% | 0.5% | -3.2% | -13.9% | 44 | 8 |
| Washington, DC | $2,085,533 | 8.5% | -8.4% | -2.0% | 7.9% | 0.7% | 55 | 6 |
| West Palm Beach, FL | $4,052,175 | 0.2% | 28.6% | 36.2% | 4.7% | 8.5% | 112 | 12 |