



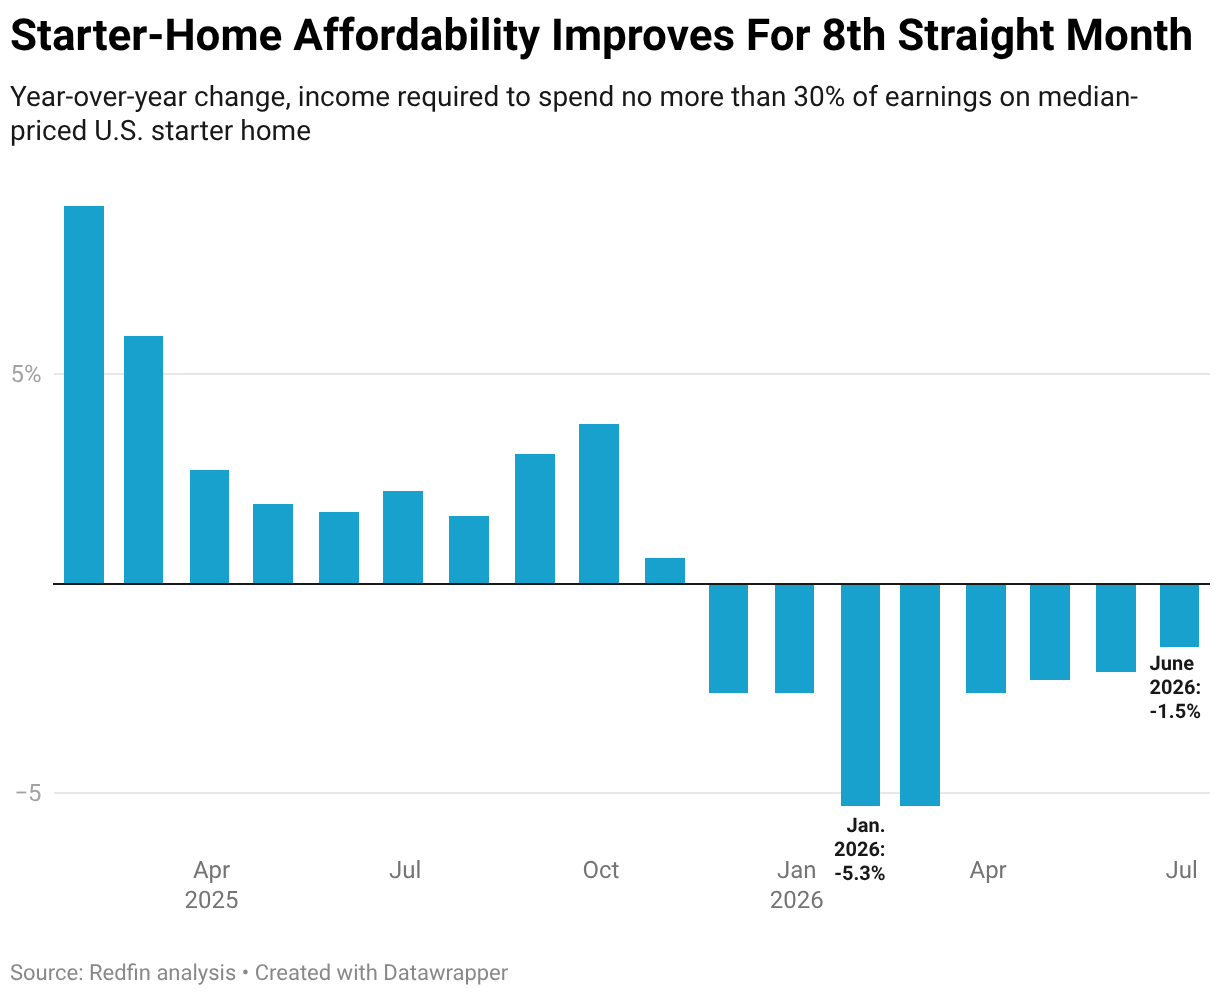
- Starter-home affordability is improving: The income needed to afford a typical U.S. starter home is down 1.5% from a year ago, marking eight straight months of declines as price growth cools.
- Affordability for entry-level homes is improving more than the overall market: The income needed to buy the typical U.S. home is down just 0.5% because price growth remains stronger at higher price points as affluent buyers remain active.
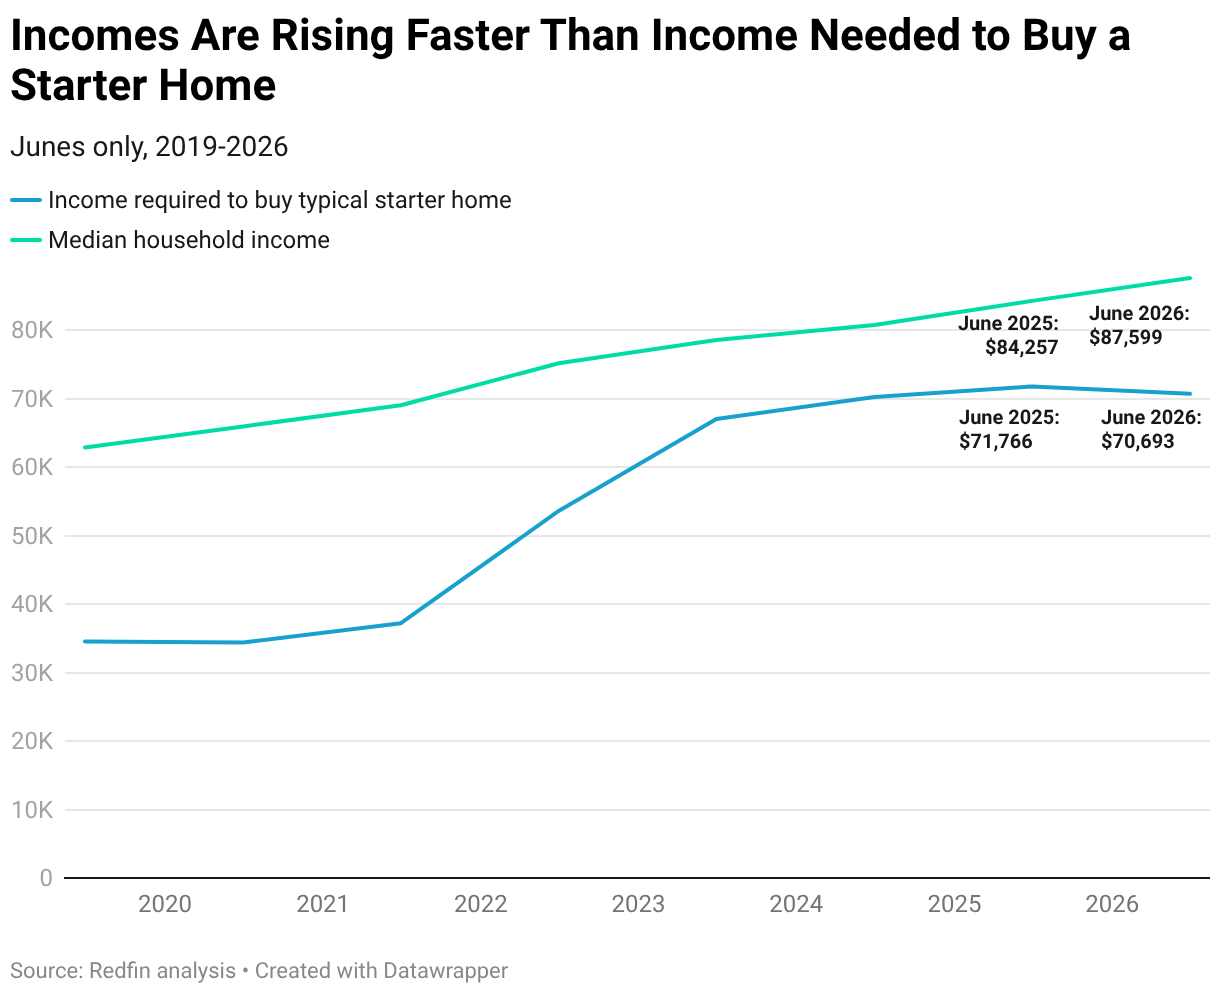
- Typical incomes are pulling further ahead: The median U.S. household now earns about $17,000 more than what’s needed to afford a starter home, up from $12,500 a year ago.
- More starter homes are within reach: The typical household would spend 24% of its income on a starter home, down from 26% a year ago, and 71% of starter-home listings are affordable on the median income, up from 65%.
- Affordability varies widely by market: Every starter-home listing is affordable on the median income in 22 of the most populous U.S. metros, but none are in Southern California.
- Most metros are becoming more affordable: Austin leads the nation in improving starter-home affordability, while Detroit, Philadelphia and Cleveland are becoming less affordable—though typical local households can still generally afford starter homes.
Americans need to earn $70,693 to afford the typical U.S. starter home, down 1.5% from a year ago. The income needed to afford a starter home–those in the 5th to 35th percentile for sale prices–has been falling since November 2025.
But the declines are shrinking; in January, for instance, the income needed to afford a starter home fell 5.3% year over year. That’s largely because mortgage rates have risen throughout 2026, pushing up housing costs.
We consider a home affordable if a buyer taking out a mortgage would spend no more than 30% of their income on their monthly housing payment. Starter homes are those in the 5th to 35th percentile for sale prices. This is based on a Redfin analysis of median home sale prices, prevailing mortgage rates and property-tax payments, and assumes a 15% down payment. This report focuses on June 2026—the most recent period for which data is available.
The income needed to buy a starter home is declining while earnings are rising. The typical American household earns an estimated $87,599, about $17,000 more than what’s needed to buy the median-priced U.S. starter home. That gap is widening: A year ago, the typical American earned roughly $12,500 more than they needed to buy a starter home.
Affordability is improving more for entry-level homes than for the housing market as a whole. Americans need to earn $109,796 to afford the typical U.S. home for sale, down just 0.5% from an all-time high of $110,382 a year ago.
Affordability is improving a bit faster for starter homes because their prices are increasing at a slower rate; the median price rose 1.2% year over year in June, compared with a 2.2% increase for all homes. The typical household earns about $22,000 less than they need to buy the median-priced home in the overall market. The discrepancy is partly because the overall market is driven by outsized price increases in the luxury segment, and outsized price increases in places like San Francisco and West Palm Beach, where affluent buyers are active. At the same time, some would-be buyers of starter homes are pulling back because they typically earn less money and are more sensitive to affordability pressures.
Affordability is improving for starter homes by a few other measures, too:
- Decline in share of earnings spent on housing. The typical American would need to spend 24.2% of their earnings to afford the median-priced starter home, down from 25.6% a year ago. That’s because prices of starter homes are growing slower than wages. A common rule of thumb in housing is that you should spend no more than 30% of your income on your monthly housing payment.
- Uptick in the number of affordable listings. More than seven in 10 (71.4%) of U.S. home listings were affordable to someone earning the median income in June, up from 64.7% a year earlier.
While starter-home affordability has improved modestly, it is still strained, with sale prices near record highs and mortgage rates elevated near 7%–and it is becoming even more strained, with rates hitting their highest level in a year at the end of July. Even though starter homes cost less than others, they’re still often out of reach for first-time buyers, especially in expensive markets like coastal California and New York. First-time buyers are also competing with move-up buyers, who typically have equity from previous sales, for starter homes.
“Affordability has improved modestly for entry-level buyers, but starter homes come with tradeoffs, and finding the right one is a challenge,” said Yingqi Xu, a senior economist at Redfin. “The first-time buyers who are in the market are already stretching their budgets to afford monthly mortgage payments, so they’re hesitant to take on expensive renovations. Move-in ready starter homes attract strong demand, while fixer-uppers aren’t quite as desirable because the buyers who are typically in the market for an inexpensive home don’t have much financial cushion for renovations.”
Starter homes are selling slightly slower than homes in the overall market. Sales of starter homes rose 2.2% year over year during the three months ending in June, compared with a 3.3% increase for median-priced homes. The typical starter home spent four more days on the market than median priced homes: 43 versus 39.
Every Single Starter-Home Listing Is Affordable in Almost Half of the Biggest U.S. Metros
All starter-home listings are affordable on the area’s median income in nearly half of the metros in this analysis, mostly in the south and Middle America.
Here’s the full list of 22 metro areas: Austin, Fort Worth, Charlotte, Dallas, Virginia Beach, Houston, Montgomery County, PA, Washington, D.C., San Antonio, Jacksonville, Milwaukee, Columbus, Cincinnati, Kansas City, Philadelphia, Indianapolis, Baltimore, Warren, Cleveland, St. Louis, Pittsburgh, Detroit.
In Detroit, the median-earning household would spend just 13.9% on a starter home, the smallest share in the U.S., followed by Pittsburgh (14.8%) and St. Louis (14.9%).
In California, Starter Homes Are Out of Reach
While starter homes are affordable in much of the country, they are almost impossible for average locals to buy in the most expensive markets.
In three California metro areas–San Diego, Los Angeles and San Francisco–there are virtually zero starter-home listings affordable on the area’s median income. In Anaheim, just 2.6% of starter-home listings are affordable to the typical resident, and in San Jose, it’s 7.4%.
In Los Angeles, a household earning the median income would spend 51% of their income on a starter home, the highest share of the metros in this analysis. Next come two other California metros: Anaheim (47.6%) and San Francisco (47.3%).
In the Bay Area, the typical starter home costs nearly $1 million, making it tough for even someone earning the area’s high median income to afford. In San Diego and Los Angeles, the typical starter home costs roughly $650,000, putting it out of reach for people earning the median income in those places–which is lower than in the Bay Area, but higher than nationwide.
Starter Homes Are Becoming More Affordable in Most of the Country
Starter-home affordability is improving in 30 of the nation’s 50 most populous metro areas. In Austin, TX, homebuyers needed to earn $92,607 to afford a median-priced home, down 6.1% year over year–the biggest decline of the metros in this analysis.
Oakland, CA had the second-biggest decline: Buyers there must earn $162,765 down 6% year over year. Dallas, where buyers must earn $83,096, down 5.1%, rounds out the top three.
On the flip side, it got harder to afford a starter home in Detroit, where buyers must earn 8.3% more than a year ago. It’s followed by Cleveland (6.1% more) and Nassau County, NY (3.7% more). Still, buyers in Detroit and Cleveland, which are relatively affordable, typically earn much more than necessary to afford a starter home. In Detroit, for instance, the typical local household earns $65,687, versus the $30,511 necessary to afford the median-priced starter home.
In more than half of the major metros, including Detroit and Cleveland, the typical household earns more than what’s needed to afford a starter home.
| Metro-Level Summary: Income Needed to Afford a Starter Home, June 2026
We analyzed the 50 most populous U.S. CSBAs and included the 46 with sufficient data |
|||||
| U.S. metro area | Income required to afford typical starter home | Income required to afford typical starter home, YoY change | Estimated median income | Share of income required to afford a starter home | Share of starter-home listings affordable to median-earning household |
| Anaheim, CA | $200,255 | -0.9% | $126,178 | 47.61% | 2.6% |
| Austin, TX | $92,607 | -6.1% | $109,059 | 25.47% | 100.0% |
| Baltimore, MD | $68,647 | 2.4% | $112,328 | 18.33% | 100.0% |
| Boston, MA | $141,696 | -1.1% | $127,467 | 33.35% | 28.1% |
| Charlotte, NC | $76,552 | -1.3% | $91,545 | 25.09% | 100.0% |
| Cincinnati, OH | $58,734 | 2.8% | $89,002 | 19.80% | 100.0% |
| Cleveland, OH | $43,336 | 6.1% | $78,519 | 16.56% | 100.0% |
| Columbus, OH | $64,501 | 0.4% | $91,468 | 21.16% | 100.0% |
| Dallas, TX | $83,096 | -5.1% | $103,144 | 24.17% | 100.0% |
| Denver, CO | $108,689 | -4.6% | $116,323 | 28.03% | 68.0% |
| Detroit, MI | $30,511 | 8.3% | $65,687 | 13.93% | 100.0% |
| Fort Worth, TX | $77,886 | -4.9% | $93,102 | 25.10% | 100.0% |
| Houston, TX | $70,384 | -4.0% | $90,865 | 23.24% | 100.0% |
| Indianapolis, IN | $56,033 | -0.1% | $90,927 | 18.49% | 100.0% |
| Jacksonville, FL | $65,957 | -3.9% | $88,715 | 22.30% | 100.0% |
| Kansas City, MO | $60,790 | 0.7% | $92,718 | 19.67% | 100.0% |
| Las Vegas, NV | $87,481 | -4.1% | $82,975 | 31.63% | 46.1% |
| Los Angeles, CA | $166,231 | -4.0% | $97,775 | 51.00% | 0.0% |
| Miami, FL | $92,851 | -3.3% | $77,854 | 35.78% | 32.9% |
| Milwaukee, WI | $64,459 | 2.8% | $86,909 | 22.25% | 100.0% |
| Montgomery County, PA | $97,537 | -0.1% | $127,721 | 22.91% | 100.0% |
| Nashville, TN | $86,853 | -2.4% | $96,448 | 27.02% | 78.7% |
| Nassau County, NY | $163,351 | 3.7% | $149,811 | 32.71% | 32.8% |
| New Brunswick, NJ | $113,112 | 0.6% | $122,960 | 27.60% | 68.2% |
| New York, NY | $132,117 | 1.5% | $98,287 | 40.33% | 24.1% |
| Newark, NJ | $120,830 | 1.4% | $113,773 | 31.86% | 41.0% |
| Oakland, CA | $162,765 | -6.0% | $139,407 | 35.03% | 26.9% |
| Orlando, FL | $79,058 | -1.7% | $85,400 | 27.77% | 72.1% |
| Philadelphia, PA | $49,204 | 2.2% | $75,254 | 19.62% | 100.0% |
| Phoenix, AZ | $88,154 | -4.4% | $95,979 | 27.55% | 76.9% |
| Pittsburgh, PA | $41,213 | 3.4% | $83,419 | 14.82% | 100.0% |
| Portland, OR | $114,334 | -2.6% | $105,952 | 32.37% | 35.0% |
| Providence, RI | $107,457 | 3.6% | $94,620 | 34.07% | 23.1% |
| Riverside, CA | $111,413 | -3.9% | $97,116 | 34.42% | 24.5% |
| Sacramento, CA | $118,531 | -2.5% | $105,873 | 33.59% | 23.9% |
| San Antonio, TX | $62,859 | -3.7% | $83,650 | 22.54% | 100.0% |
| San Diego, CA | $170,647 | -2.9% | $115,304 | 44.40% | 0.0% |
| San Francisco, CA | $255,320 | -4.6% | $162,118 | 47.25% | 0.4% |
| San Jose, CA | $253,882 | -1.9% | $176,401 | 43.18% | 7.4% |
| Seattle, WA | $155,049 | -3.4% | $131,404 | 35.40% | 28.7% |
| St. Louis, MO | $44,049 | 3.0% | $88,593 | 14.92% | 100.0% |
| Tampa, FL | $67,827 | -3.5% | $81,390 | 25.00% | 90.1% |
| Virginia Beach, VA | $71,667 | 1.2% | $91,854 | 23.41% | 100.0% |
| Warren, MI | $58,325 | 0.7% | $96,676 | 18.10% | 100.0% |
| Washington, DC | $107,583 | -0.9% | $141,029 | 22.89% | 100.0% |
| West Palm Beach, FL | $71,719 | -3.4% | $90,688 | 23.72% | 83.3% |
