
- The typical buyer who scored a home for below the list price in 2025 got a 7.9% discount—the largest since 2012.
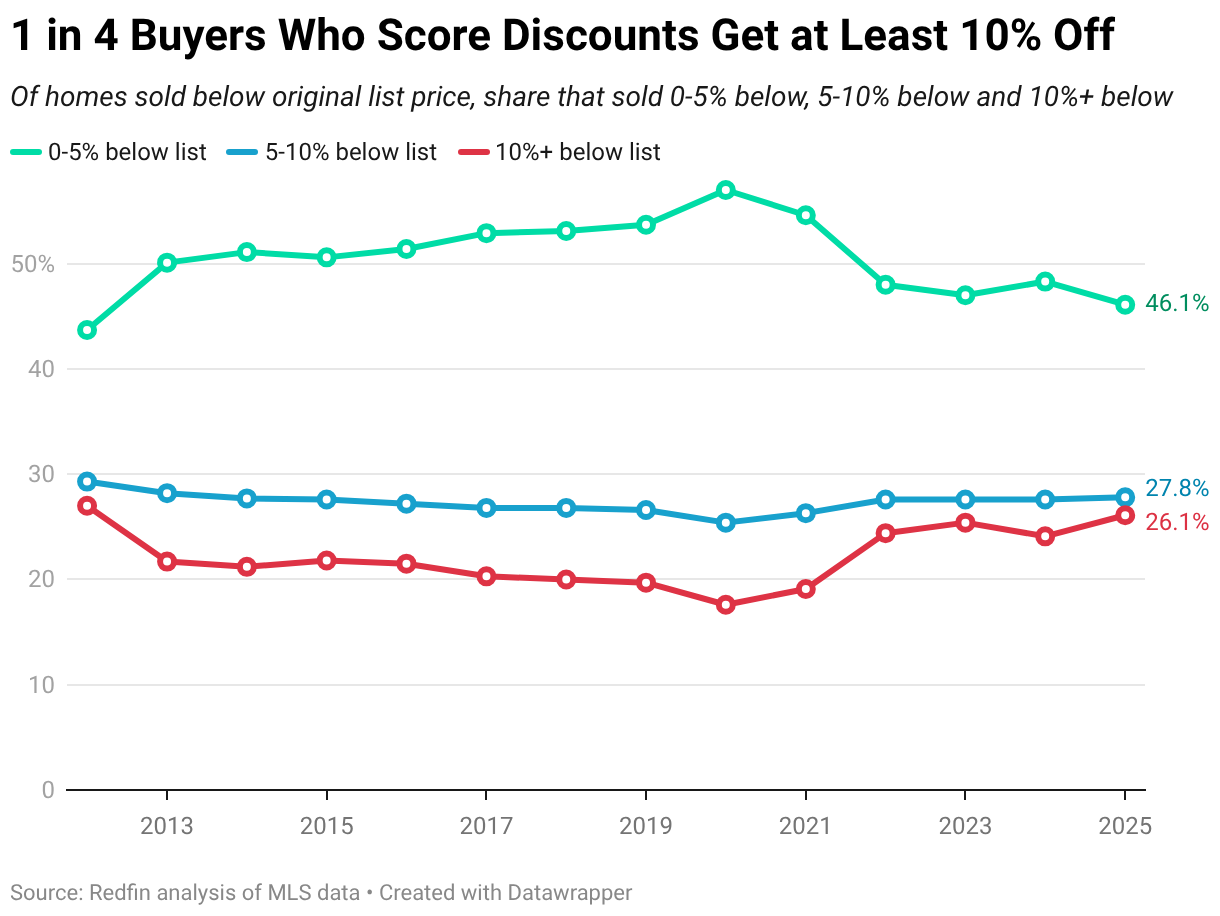
- 1 in 4 buyers who got discounts scored 10% or more off the list price—the highest share since 2012.
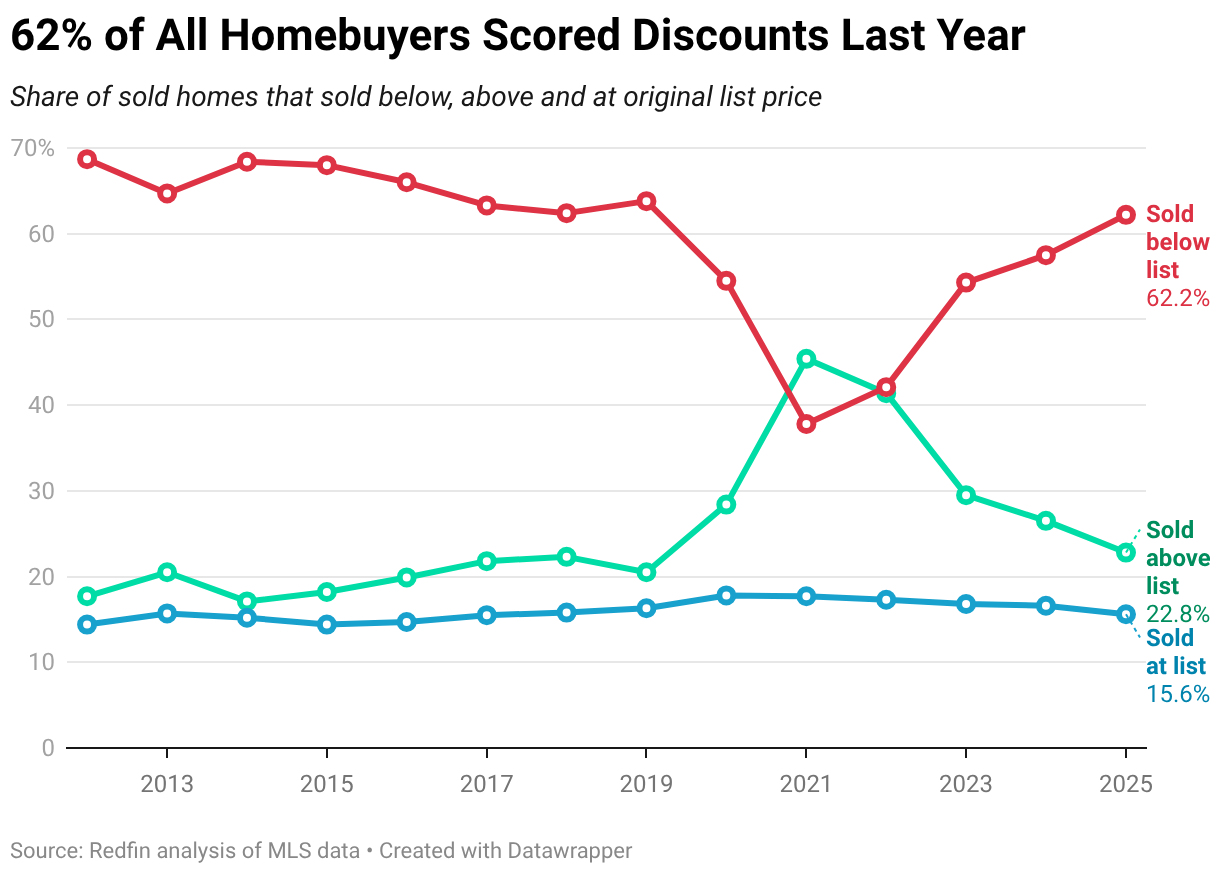
- Nearly two-thirds of all homebuyers got discounts last year—the highest share since 2019.
The typical homebuyer who purchased a home for below the list price in 2025 got a 7.9% discount—the largest since 2012.
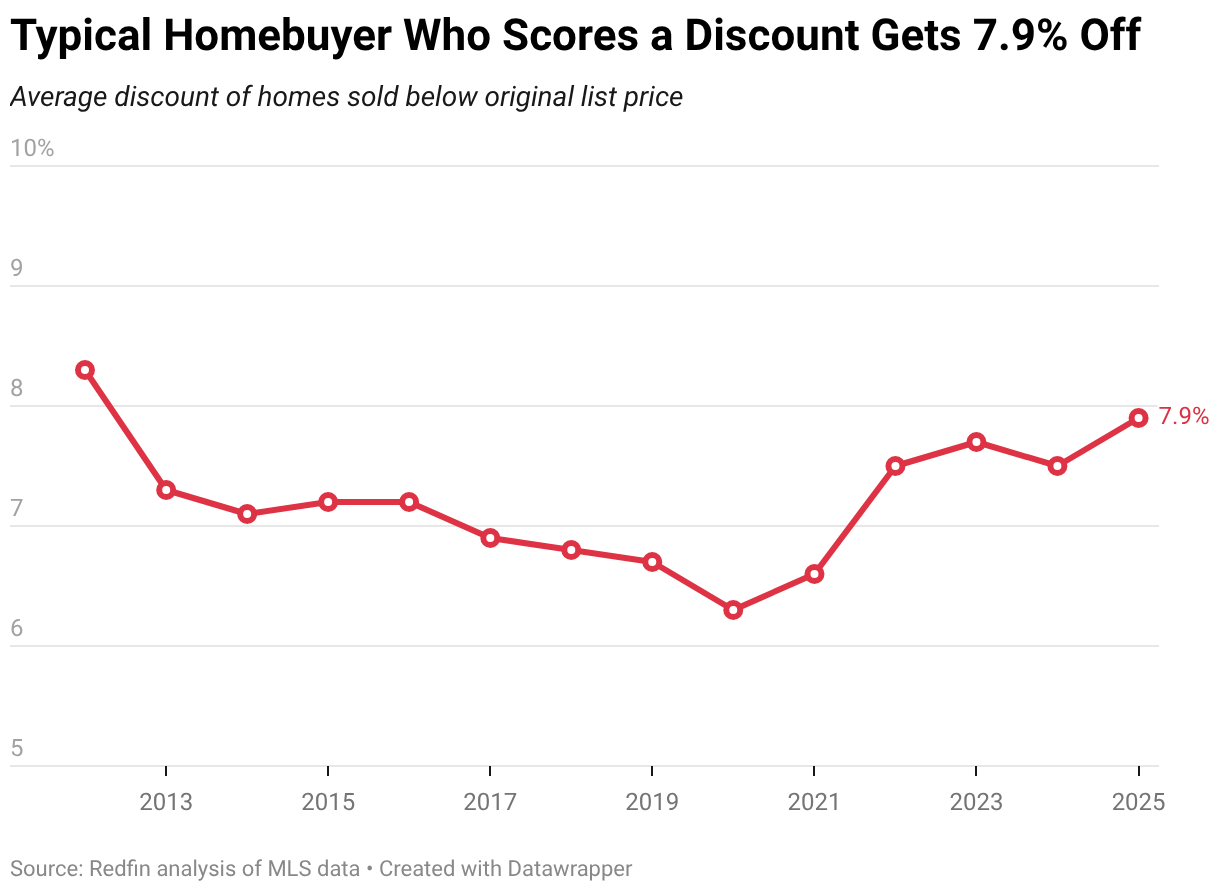
This is based on a Redfin analysis of annual MLS data comparing original list prices with final sale prices.
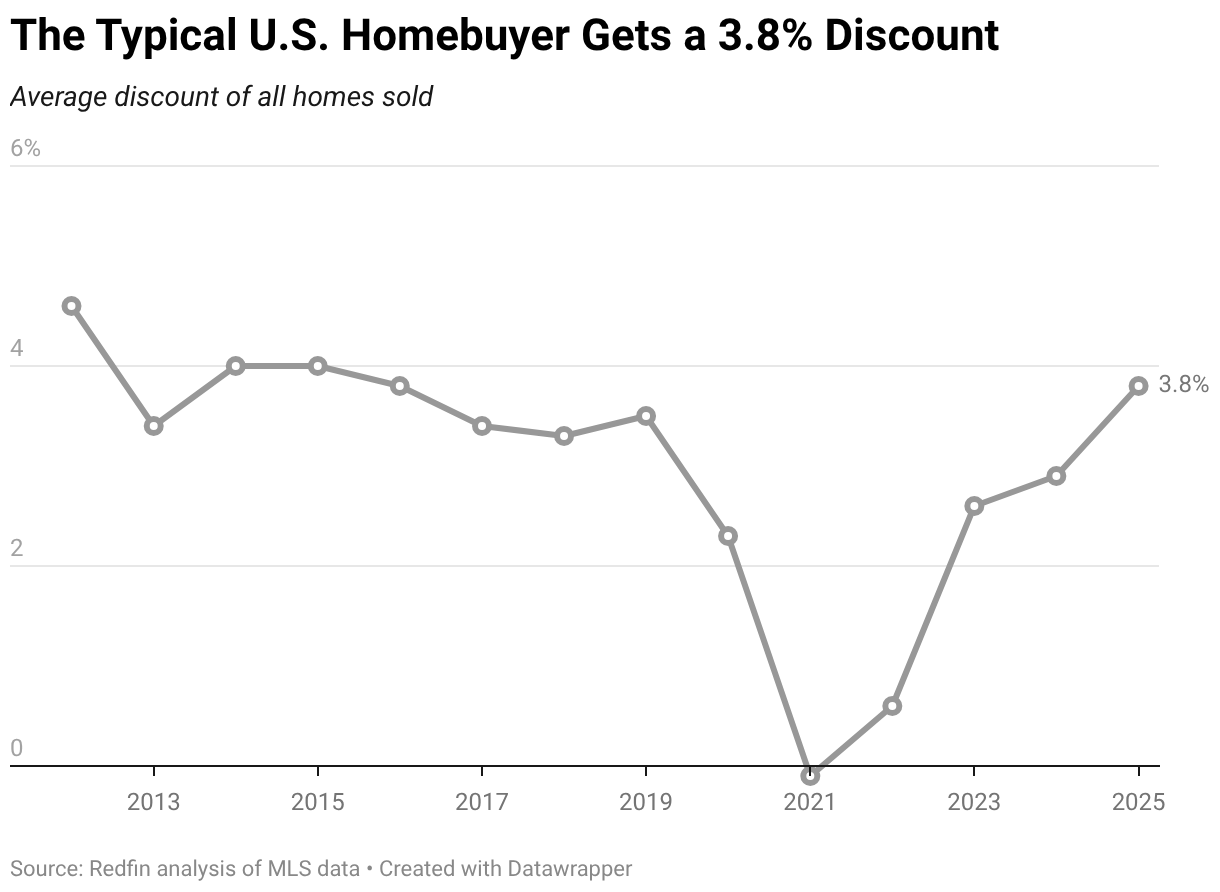
In dollar terms, the typical homebuyer who paid less than the list price in 2025 got a $31,592 discount, which we calculated by applying the 7.9% average discount to last year’s median original list price of $399,900. Among all homebuyers (not just those who paid less than the list price), the average discount was $15,196, or 3.8%.
Nearly two-thirds (62.2%) of all homebuyers in 2025 paid less than the list price—the highest share since 2019. By comparison, 22.8% paid more than the list price—the lowest share since 2019. Just under 1 in 6 (15.6%) paid the exact list price—a share that has remained relatively steady over the years.
Homebuyers are more likely to get discounts than they were in recent years because it’s the strongest buyer’s market in recent history. There are a record 47% more home sellers than buyers, giving the buyers who are in the market options and negotiating power.
Buyers have retreated due to high mortgage rates and home prices, and some sellers haven’t adjusted to the fact that demand is much slower than it was during the pandemic homebuying frenzy. They watched their neighbor’s home sell for tens of thousands of dollars over the asking price back then, and are now pricing their homes based on that. This mindset is particularly prevalent among sellers who bought their home during the peak of the pandemic market; they paid top dollar and now want to sell for top dollar so they don’t end up in the red. The challenge is that today’s market isn’t nearly as hot. Consequently, many sellers are having to cut their prices, and some are delisting in hopes of selling at a higher price down the road.
“Homebuyers in 2026 shouldn’t write off homes that are slightly above their budget because there’s a good chance they’ll get some sort of concession from the seller, be it a price cut, money toward closing costs or funds for repairs,” said Redin Senior Economist Asad Khan. “This marks a reversal from the pandemic homebuying frenzy, when house hunters were advised to search for homes below their budget because fierce bidding wars were causing properties to sell far above the asking price.”
Discounts have become increasingly common partly because homes have become increasingly tough to price, with market dynamics shifting rapidly and varying widely from place to place, Khan said. Housing demand remains strong in some areas, but is quickly softening in many others.
| 2025 | 2024 | |
| Average discount of homes sold below original list price | 7.9% | 7.5% |
| Average discount of all homes sold | 3.8% | 2.9% |
| Share of homes sold below original list price | 62.2% | 57.5% |
| Share of homes sold above original list price | 22.8% | 26.5% |
| Share of homes sold at original list price | 15.6% | 16.7% |
| Median original list price | $399,900 | $390,000 |
It’s worth noting that while the share of homebuyers getting discounts has been rising, it’s still below pre-pandemic levels. That’s partly because the share of buyers paying a premium, while falling, is still above pre-pandemic levels. After years of seeing homes sell above the list price, sellers are asking for prices that are at the edge of what buyers can afford—causing most homes to sell below the list price again.
The Share of Buyers Getting Discounts of 10% or More Is At a 13-Year High
Roughly one-quarter (26.1%) of homebuyers who paid below the list price in 2025 got a discount of 10% or more—the highest share since 2012. A similar share (27.8%) scored a discount of 5-10%—the highest share since 2013. The lion’s share (46.1%) scored a discount of 0-5%, the lowest share since 2012.
“Some sellers are recognizing the market has changed and others are not,” said Connie Durnal, a Redfin Premier real estate agent in Dallas. “I have one seller who overpaid for their home a few years ago and wants to list it at $950,000. The problem is recent comps call for a list price of $825,000. I have another seller who paid $400,000 for their home but was willing to list it at $385,000, which was a great strategy. Because the home was fairly priced, it got multiple offers and sold for $10,000 over the asking price.”
Many sellers have a certain price threshold they want to clear before they sell, according to Ben Ambroch, a Redfin Premier real estate agent in Milwaukee.
“A lot of sellers scored 2-3% mortgage rates during the pandemic, and are only willing to sell and give up that rate if they can make enough money to cover the monthly payment on their next home,” he said.
Condo Buyers Are Scoring the Biggest Discounts
The typical condo buyer who paid below the list price in 2025 got an 8.1% discount, compared with a 7.9% discount for single-family-home buyers and a 6.5% discount for townhouse buyers.
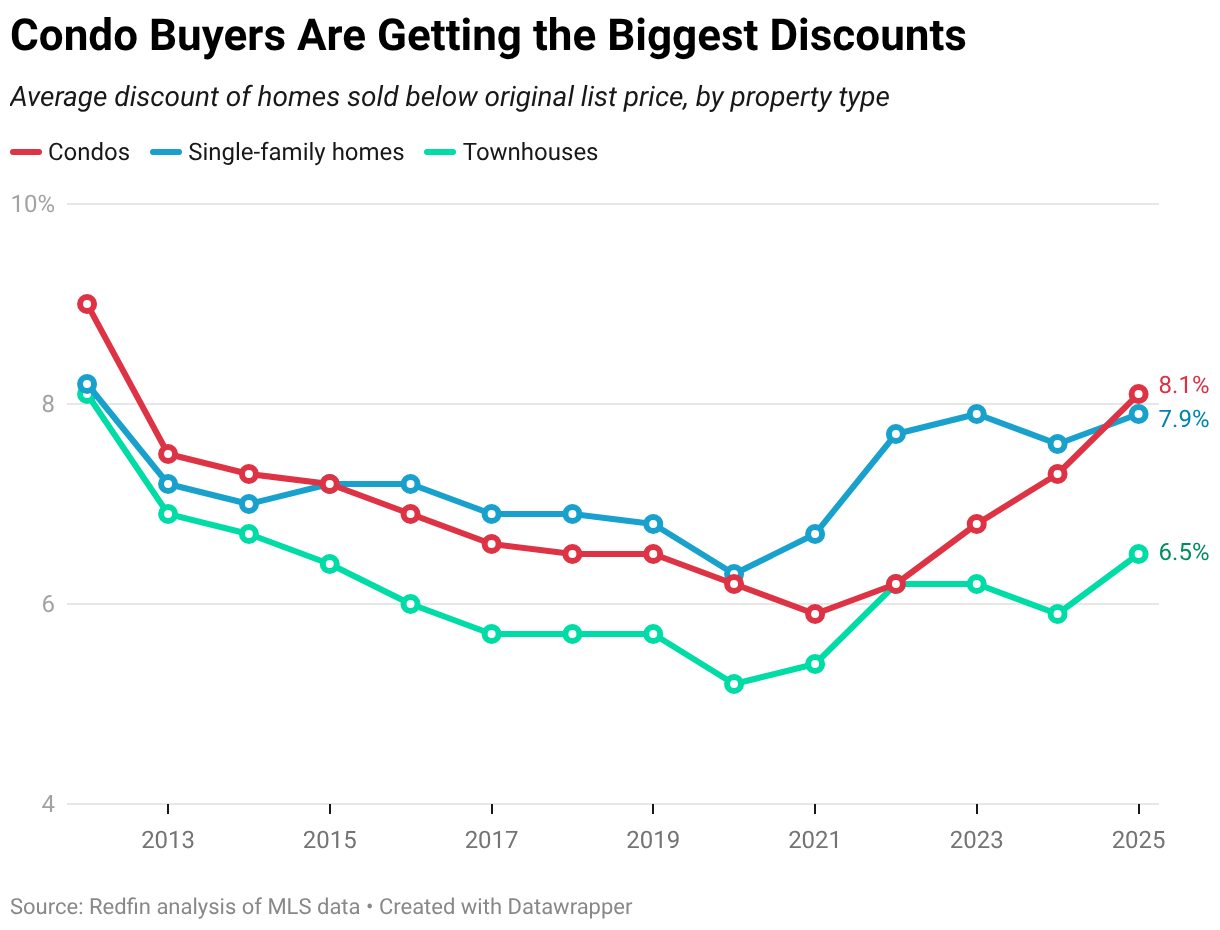
Last year was the first year since 2014 when condos sold at a bigger discount than single-family homes. Condo demand has dropped because HOA fees and insurance costs have been soaring, and some homeowners’ associations are doling out hefty special assessments.
Among all condo buyers (not just those who got discounts), the average discount was 4.8%, compared with 3.7% for single-family-home buyers and 3% for townhouse buyers.
Overall, 68.1% of condo buyers last year paid less than the list price, compared with 61.7% of single-family-home buyers and 60.4% of townhouse buyers.
Homebuyers In West Palm Beach Are Scoring the Biggest Discounts
In West Palm Beach, FL, the typical homebuyer who paid less than the list price in 2025 got a 10.9% discount—the largest among the 50 most populous U.S. metropolitan areas. Next comes Detroit (10.3%), followed by Fort Lauderdale, FL (10.3%), Pittsburgh (9.9%) and Miami (9.8%).
Florida builds more homes than any other state but Texas, meaning that buyers have a lot of negotiating power because they have a lot of homes to choose from. It’s also grappling with intensifying natural disasters, soaring insurance premiums and rising condo HOA fees, which have forced sellers to offer concessions.
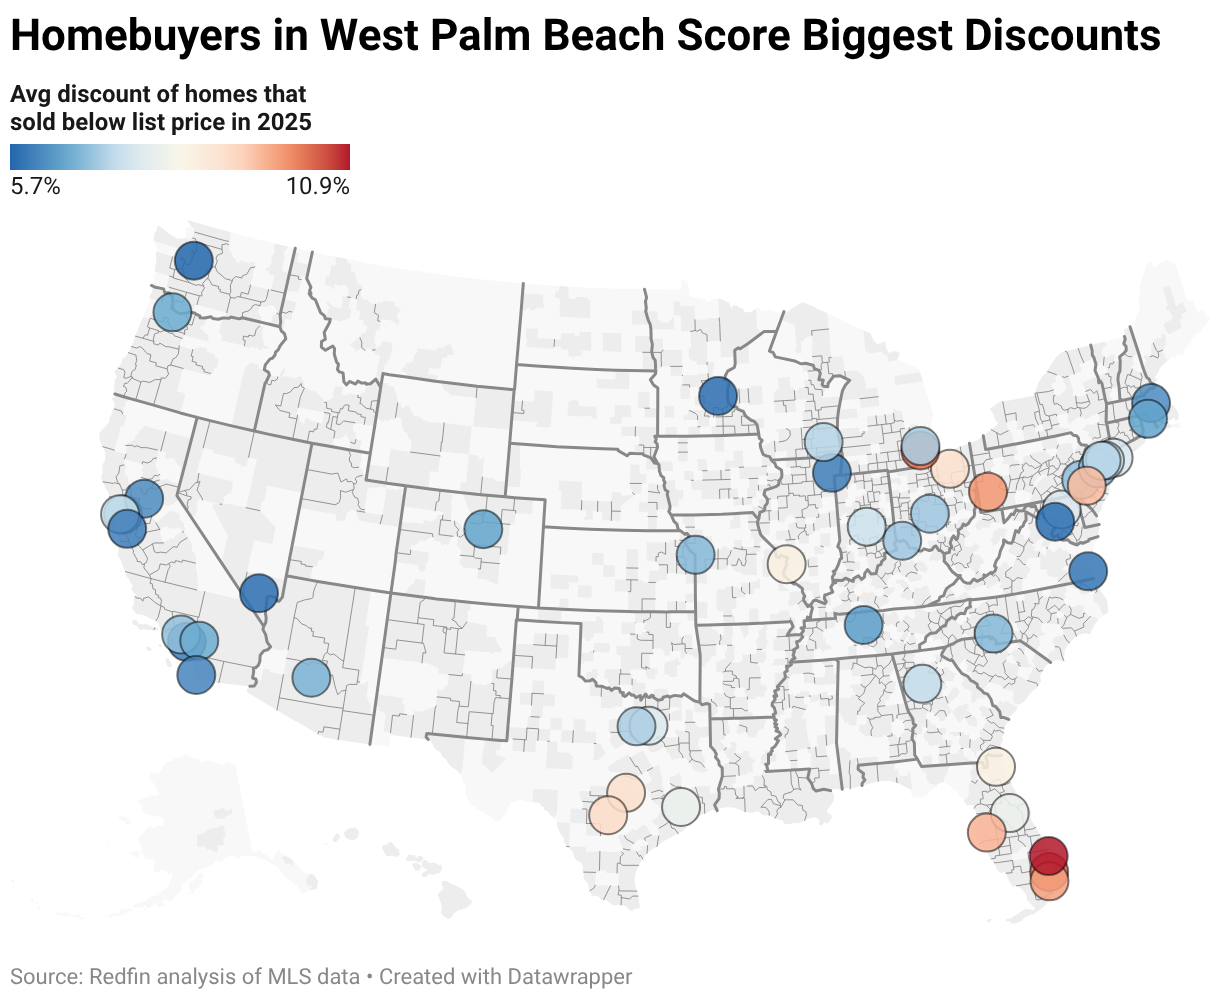
In Seattle, the typical homebuyer who paid less than the list price got a 5.7% discount—the smallest among the top 50 metros. It’s followed by Washington, D.C. (5.8%), Minneapolis (5.8%), Las Vegas (5.8%) and Virginia Beach, VA (5.9%).
There Are Only 4 Places Where the Typical Homebuyer Pays Over the Asking Price
There are only four metros where the typical homebuyer paid more than the asking price last year. In San Francisco, the typical homebuyer paid 3.8% above the asking price—the biggest premium in the nation. The other three metros are Newark, NJ (3.1%), San Jose, CA (2.3%) and Oakland, CA (1.3%).
The Bay Area housing market has heated up in recent months amid a boom in the AI sector and a return to the office. It’s also worth noting that it’s typical for Bay Area homes to sell for a premium because Bay Area sellers have been known to purposely underprice their homes to create bidding wars—but this premium has been shrinking.
2025 Metro-Level Summary: 50 Most Populous Metro Areas
| U.S. metro area | Median original list price | Share of homes that sold below original list price | Average discount for all homes that sold | Average discount for homes that sold below original list price |
|---|---|---|---|---|
| Anaheim, CA | $1,200,000 | 59.2% | 2.2% | 6.0% |
| Atlanta, GA | $409,900 | 68.5% | 4.5% | 7.3% |
| Austin, TX | $474,958 | 82.3% | 7.1% | 9.0% |
| Baltimore, MD | $400,000 | 46.9% | 1.2% | 7.6% |
| Boston, MA | $749,000 | 45.7% | 0.3% | 6.2% |
| Charlotte, NC | $428,104 | 68.9% | 4.2% | 6.8% |
| Chicago, IL | $369,900 | 50.0% | 1.3% | 6.0% |
| Cincinnati, OH | $314,888 | 57.0% | 2.7% | 7.0% |
| Cleveland, OH | $249,000 | 54.5% | 3.0% | 9.0% |
| Columbus, OH | $352,000 | 55.2% | 2.6% | 7.0% |
| Dallas, TX | $435,000 | 79.4% | 5.8% | 7.7% |
| Denver, CO | $608,900 | 67.0% | 3.8% | 6.5% |
| Detroit, MI | $205,250 | 52.9% | 3.6% | 10.3% |
| Fort Lauderdale, FL | $489,000 | 86.9% | 8.7% | 10.3% |
| Fort Worth, TX | $372,500 | 74.0% | 4.9% | 7.1% |
| Houston, TX | $354,900 | 78.0% | 5.9% | 8.0% |
| Indianapolis, IN | $325,000 | 65.1% | 4.2% | 7.4% |
| Jacksonville, FL | $389,000 | 78.6% | 6.4% | 8.5% |
| Kansas City, MO | $349,900 | 49.5% | 1.9% | 6.8% |
| Las Vegas, NV | $459,000 | 70.5% | 3.8% | 5.8% |
| Los Angeles, CA | $925,000 | 54.9% | 1.9% | 6.9% |
| Miami, FL | $599,000 | 85.4% | 8.1% | 9.8% |
| Milwaukee, WI | $349,900 | 42.5% | 0.6% | 7.2% |
| Minneapolis, MN | $399,000 | 50.2% | 1.5% | 5.8% |
| Montgomery County, PA | $499,000 | 42.3% | 0.3% | 6.9% |
| Nashville, TN | $494,000 | 63.7% | 3.6% | 6.4% |
| Nassau County, NY | $725,000 | 44.3% | 0.4% | 7.6% |
| New Brunswick, NJ | $569,000 | 47.1% | 0.8% | 6.9% |
| New York, NY | $798,000 | 55.8% | 1.9% | 7.4% |
| Newark, NJ | $599,000 | 32.0% | -3.1% | 7.2% |
| Oakland, CA | $899,000 | 46.9% | -1.3% | 6.5% |
| Orlando, FL | $429,000 | 75.5% | 5.7% | 8.0% |
| Philadelphia, PA | $299,999 | 57.8% | 3.8% | 9.5% |
| Phoenix, AZ | $483,990 | 75.7% | 4.8% | 6.7% |
| Pittsburgh, PA | $259,900 | 62.1% | 4.9% | 9.9% |
| Portland, OR | $569,900 | 58.8% | 2.9% | 6.6% |
| Providence, RI | $499,900 | 43.1% | 0.7% | 6.5% |
| Riverside, CA | $599,000 | 60.6% | 3.1% | 6.6% |
| Sacramento, CA | $599,000 | 61.2% | 2.9% | 6.2% |
| San Antonio, TX | $325,000 | 80.6% | 7.0% | 9.1% |
| San Diego, CA | $925,000 | 58.9% | 2.5% | 6.1% |
| San Francisco, CA | $1,450,000 | 38.9% | -3.8% | 7.4% |
| San Jose, CA | $1,580,000 | 39.3% | -2.3% | 6.0% |
| Seattle, WA | $848,000 | 49.6% | 1.5% | 5.7% |
| St. Louis, MO | $280,000 | 49.6% | 2.1% | 8.5% |
| Tampa, FL | $399,000 | 77.6% | 7.1% | 9.6% |
| Virginia Beach, VA | $369,000 | 43.3% | 1.5% | 5.9% |
| Warren, MI | $325,000 | 53.5% | 2.3% | 7.1% |
| Washington, DC | $595,000 | 48.6% | 1.6% | 5.8% |
| West Palm Beach, FL | $549,000 | 87.9% | 9.3% | 10.9% |
| National—U.S.A. | $399,900 | 62.2% | 3.8% | 7.9% |