
-
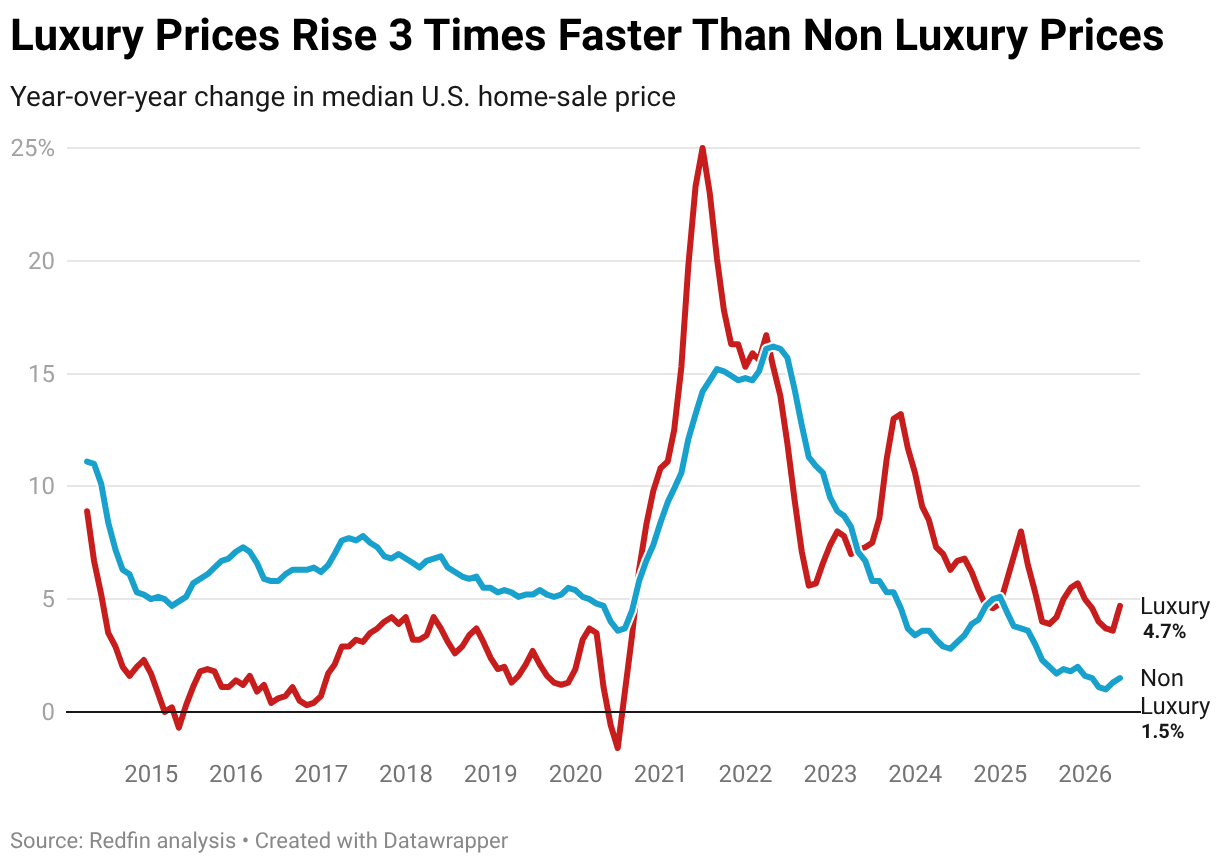
- Luxury U.S. home prices are up 4.7% year over year, compared to a 1.5% increase in non luxury prices, as homebuying demand from affluent people continues to outpace demand from average Americans.
- High-end buyers are more active partly because they’re less sensitive to high mortgage rates and today’s economic uncertainty.
- Luxury prices are rising fastest in Tampa and Miami, partly due to an influx of ultra-wealthy people moving into Florida.
- Luxury sales are rising fastest in San Francisco, largely due to the AI boom, followed by Nashville, San Diego and several Florida metros.
The median U.S. luxury home sale price rose 4.7% year over year to $1.37 million during the three months ending May 31—more than triple the 1.5% gain in non luxury sale prices.
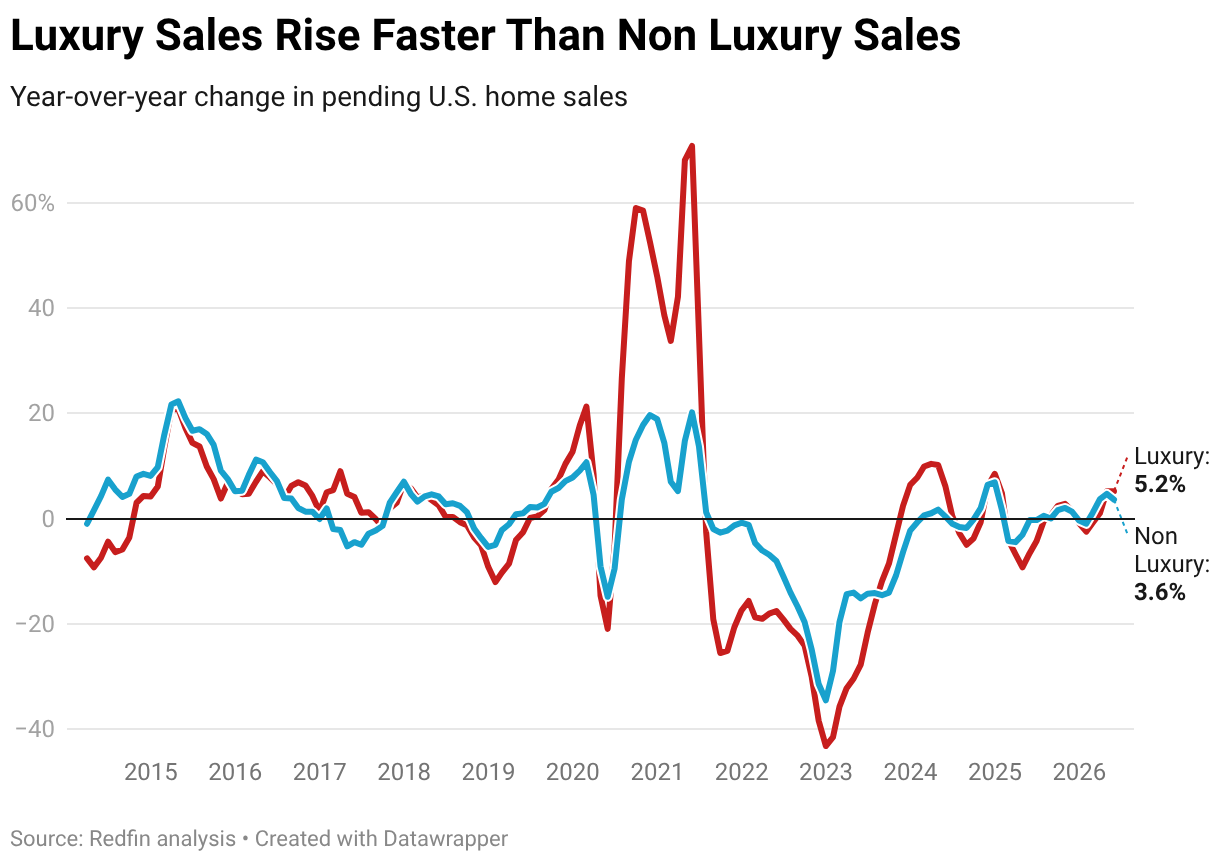
Luxury prices are increasing largely because demand for luxury homes is on the rise. Pending sales of luxury homes rose 5.2% year over year—the largest gain since December 2024. That’s compared with a 3.6% gain in non luxury pending sales, which is a deceleration from the month before.
This report is based on a Redfin analysis of MLS data that is subject to revision. All figures cover rolling three-month periods. Redfin defines luxury homes as those estimated to be in the top 5% of their metro area’s price range, while non-luxury homes fall into the 35th–65th percentile.
High-end homebuyers are more active because they’re less sensitive to the affordability pressures and financial instability facing many Americans today. Overall homebuying demand has been fairly slow because mortgage rates and home prices remain stubbornly high, pricing many regular house hunters out of the market. Additionally, the economic uncertainty stemming from the back-and-forth on the Iran war, inflation, and the possibility of the Fed hiking interest rates is making some prospective buyers think twice about making a huge purchase. Ultra-wealthy Americans, by contrast, have more money to pay high housing costs, and they have the freedom to make big purchases even in uncertain times.
“The luxury market has been immune to the housing slowdown, especially in the most desirable, beachfront areas,” said Mike DeMello, a Redfin Premier agent in Honolulu. “Affluent buyers who can afford luxurious homes are often insulated from things like high mortgage rates and economic uncertainty. Meanwhile, a lot of locals are choosing to rent because prices and rates are simply too high to buy.”
Tampa and Miami Lead Nation in Luxury Home-Price Growth
Luxury home prices in Tampa, FL rose 15.6% year over year, the biggest increase of the 50 most populous U.S. metros, followed closely by Miami (14.2%). By contrast, non luxury prices fell 0.5% in Tampa, and they fell 0.7% in Miami.
Luxury prices are rising in coastal Florida while non luxury prices are ticking down because affluent buyers are buying up homes in the Sunshine State. Three of the 10 U.S. metros with the biggest increases in luxury pending sales were in Florida: Tampa comes in fourth, with a 20.8% increase in pending sales, West Palm Beach is fifth (18.5% increase), and Miami is seventh (14.6%).
Billionaires, tech entrepreneurs, executives and other wealthy Americans are drawn to Florida for its favorable tax environment, warm climate and waterfront lifestyle, driving strong demand for high-end homes even as the broader housing market softens in some parts of the state. Places like Miami and West Palm Beach have become magnets for ultra-rich Americans; for instance; Mark Zuckerberg recently paid $170 billion for an estate on an island called “Billionaire Bunker.” Florida typically dominates Redfin’s list of most expensive U.S. home sales each month; those ultra-expensive sales push up median luxury prices.
Luxury Pending Sales Rising Fastest in San Francisco, Nashville and San Diego–Outpacing Florida Metros
San Francisco, Nashville, TN and San Diego are the only metros where pending luxury sales are rising faster than they are in Florida. Pending sales of San Francisco luxury homes rose 45.9% year over year, by far the biggest increase of the metros in this analysis, followed by Nashville’s 24.5% increase and San Diego’s 22.5% increase.
The Bay Area’s luxury market is soaring largely because of the AI boom, with many tech workers putting their salaries and bonuses into real estate. Nashville, as noted above, is attracting a lot of wealthy residents who move there for jobs and Tennessee’s favorable tax environment. San Diego is capturing some spillover from Los Angeles, with some affluent house hunters choosing coastal San Diego instead of places like Beverly Hills for privacy, a slower pace of life and oceanfront access.
Luxury Homeowners Are Listing at a Slightly Higher Rate Than Everyone Else
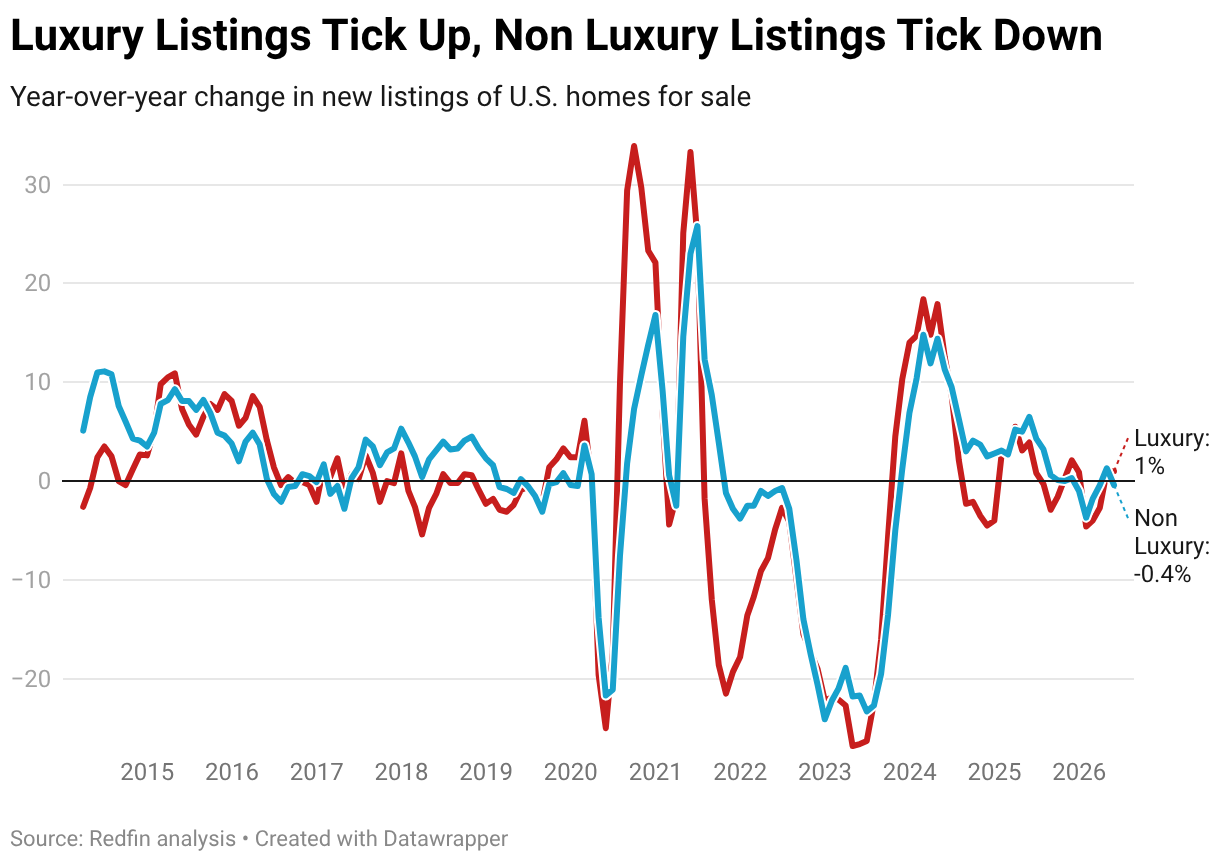
On the selling side, new listings of U.S. luxury homes increased 1% year over year during the three months ending May 31. That’s compared with a 0.4% decline in non luxury new listings.
Owners of luxury homes are slightly more willing to list than owners of regular homes, likely because high prices and strong demand have made this a favorable moment to cash out. But affluent homeowners don’t have a lot of incentive to sell: Many of them are locked into low mortgage rates, there are tax deterrents to selling expensive houses, and many wealthy Americans don’t need to sell their home when they move; they may be able to move into a different home and hang onto their old one.
Luxury Market Summary: Three Months Ending May 2026
| Luxury | Non Luxury | |
|---|---|---|
| Median sale price | $1,374,470 | $377,477 |
| Median sale price, YoY change | 4.7% | 1.5% |
| Pending home sales, YoY change | 5.2% | 3.6% |
| Homes sold, YoY change | 2% | 2% |
| New listings, YoY change | 1% | -0.4% |
| Active listings, YoY change | 0.4% | 1.2% |
| Median days on market | 49 | 44 |
| Median days on market, YoY change | 5 | 3 |
Metro-Level Luxury Highlights: Three Months Ending May 2026
Redfin’s metro-level luxury data is based on an analysis of the 50 most populous U.S. metropolitan areas; the 49 with sufficient data are included in this report. All changes below are year over year.
- Prices: Luxury prices rose most in Tampa, FL (15.6%), Miami (14.2%) and Las Vegas (13.7%). They fell in just four metros: New Brunswick, NJ (-4.3%), Oakland, CA (-1.8%), Detroit (-1%) and Dallas (-0.3%).
- Pending sales: Luxury pending sales rose most in San Francisco (45.9%), Nashville, TN (24.5%) and San Diego (22.5%). They fell most in Seattle (-14.8%), Nassau County, NY (-14.3%) and Baltimore (-10.4%).
- Closed home sales: Luxury home sales rose most in San Francisco (46.3%), Tampa (27.4%) and Portland, OR (13.1%).They fell most in Anaheim (-16.9%), Orlando (-13.2%) and Seattle (-13%).
- New listings: Luxury new listings rose most in Warren, MI (28.2%), Columbus, OH (12.4%) and Nashville, TN (11.4%). They fell most in Las Vegas (-16.5%), Anaheim, CA (-15.7%) and Denver (-15.7%).
- Active listings: Luxury active listings rose most in Warren, MI (20.5%), Seattle (13.9%) and Detroit (12.8%). They fell most in Anaheim (-23.2%), New York (-18.6%) and Miami (-17.2%).
- Median days on market: In Pittsburgh, the typical luxury home that went under contract did so in 54 days, down 9 days from a year earlier—the biggest decrease among the metros Redfin analyzed. Next came St. Louis (-7) and Austin, TX (-6). The biggest increases were in Miami (+24 days), Las Vegas (+23) and Nassau County, NY (+19).
| Full Metro-Level Luxury Data: Three Months Ending May 2026
Redfin analyzed the 50 most populous U.S. metro areas and included the 49 with sufficient data. Fort Lauderdale, FL is excluded. |
||||||||
| U.S. metro area | Median sale price | Median sale price, YoY change | Pending sales, YoY change | Homes sold, YoY change | New listings, YoY change | Active listings, YoY change | Median days on market | Median days on market,YoY change |
| Anaheim, CA | $5,276,971 | 2.2% | -1.1% | -16.9% | -15.7% | -23.2% | 47 | 1 |
| Atlanta, GA | $1,440,533 | 6.4% | 2.4% | -4.3% | 6.6% | 12.2% | 32 | -1 |
| Austin, TX | $1,811,150 | 9.0% | 9.3% | 5.5% | -13.4% | -10.1% | 51 | -6 |
| Baltimore, MD | $1,276,125 | 4.0% | -10.4% | -12.6% | -2.3% | -5.7% | 31 | 9 |
| Boston, MA | $2,826,655 | 7.4% | -8.6% | -6.0% | -4.3% | -4.1% | 28 | 1 |
| Charlotte, NC | $1,660,462 | 4.7% | -1.1% | -7.6% | 3.8% | 8.7% | 43 | 7 |
| Chicago, IL | $1,545,360 | 6.2% | 11.3% | 5.1% | 0.6% | -12.2% | 44 | -5 |
| Cincinnati, OH | $952,523 | 0.3% | 4.3% | -2.6% | 5.7% | 2.5% | 44 | 1 |
| Cleveland, OH | $833,228 | 11.0% | 9.4% | 3.0% | 3.1% | -2.2% | 24 | -2 |
| Columbus, OH | $1,017,342 | 2.9% | 13.0% | 5.9% | 12.4% | 6.8% | 37 | -1 |
| Dallas, TX | $1,603,312 | -0.3% | 7.1% | 1.7% | 2.4% | 6.2% | 38 | 4 |
| Denver, CO | $1,971,456 | 4.3% | -5.1% | 0.0% | -15.7% | -4.9% | 20 | 7 |
| Detroit, MI | $719,252 | -1.0% | -6.9% | 6.5% | -2.1% | 12.8% | 15 | 5 |
| Fort Worth, TX | $1,309,293 | 9.4% | 2.1% | 12.2% | -9.8% | -8.8% | 34 | 3 |
| Houston, TX | $1,361,843 | 4.9% | -4.5% | -5.8% | -7.5% | -2.2% | 28 | 9 |
| Indianapolis, IN | $1,009,314 | 9.0% | -4.1% | 2.7% | -4.6% | -6.8% | 18 | 4 |
| Jacksonville, FL | $1,589,567 | 6.9% | 4.5% | -2.6% | -5.0% | -11.5% | 54 | -1 |
| Kansas City, MO | $1,137,946 | 10.9% | -6.4% | 4.8% | -1.6% | -6.2% | 30 | -5 |
| Las Vegas, NV | $1,694,567 | 13.7% | -1.0% | -11.6% | -16.5% | -4.5% | 79 | 23 |
| Los Angeles, CA | $4,512,482 | 4.9% | 0.4% | 0.0% | -7.2% | -10.8% | 49 | 4 |
| Miami, FL | $4,855,331 | 14.2% | 14.6% | 5.2% | -13.0% | -17.2% | 150 | 24 |
| Milwaukee, WI | $1,098,057 | 8.9% | 9.8% | 0.0% | 0.3% | -6.5% | 51 | 0 |
| Minneapolis, MN | $1,284,400 | 8.1% | -5.2% | -12.6% | 5.4% | 4.8% | 31 | 3 |
| Montgomery County, PA | $1,544,219 | 8.5% | 0.0% | -2.4% | 7.3% | 10.7% | 32 | 7 |
| Nashville, TN | $2,190,591 | 7.1% | 24.5% | 10.0% | 11.4% | 8.4% | 96 | 11 |
| Nassau County, NY | $2,862,605 | 13.3% | -14.3% | -7.0% | -7.0% | -8.3% | 100 | 19 |
| New Brunswick, NJ | $1,947,027 | -4.3% | 6.5% | -5.3% | 9.6% | 4.6% | 34 | 1 |
| New York, NY | $4,380,249 | 5.0% | -2.5% | -9.5% | -12.3% | -18.6% | 83 | 16 |
| Newark, NJ | $2,126,234 | 7.9% | -3.1% | -8.6% | 5.2% | -7.6% | 15 | -3 |
| Oakland, CA | $2,999,012 | -1.8% | 1.1% | 1.9% | -6.9% | -14.9% | 12 | 0 |
| Orlando, FL | $1,437,130 | 4.5% | -6.7% | -13.2% | -6.8% | -9.9% | 41 | 11 |
| Philadelphia, PA | $1,342,284 | 11.1% | -0.3% | -1.8% | -6.0% | -3.6% | 43 | 13 |
| Phoenix, AZ | $2,225,630 | 12.6% | 14.2% | 2.0% | -5.7% | -0.1% | 70 | 5 |
| Pittsburgh, PA | $904,202 | 6.1% | 0.0% | -12.0% | 2.6% | 1.1% | 54 | -9 |
| Portland, OR | $1,459,821 | 2.0% | 2.3% | 13.1% | 3.6% | -2.4% | 24 | -2 |
| Providence, RI | $1,714,243 | 6.3% | -9.9% | -11.6% | -8.6% | -4.1% | 38 | 5 |
| Riverside, CA | $1,723,962 | 0.5% | -3.1% | -6.4% | -11.0% | -12.3% | 58 | -1 |
| Sacramento, CA | $1,721,234 | 2.8% | 11.3% | 12.3% | -3.6% | 3.0% | 32 | 8 |
| San Antonio, TX | $968,344 | 5.1% | 5.5% | -8.6% | 0.4% | 0.5% | 74 | 6 |
| San Diego, CA | $3,771,304 | 2.7% | 22.5% | 9.6% | -3.5% | -7.7% | 31 | 2 |
| San Francisco, CA | $6,648,922 | 6.0% | 45.9% | 46.3% | 5.5% | -11.5% | 13 | -2 |
| San Jose, CA | $5,654,565 | 4.4% | 2.7% | -2.4% | 7.6% | -5.5% | 9 | 0 |
| Seattle, WA | $2,992,812 | 3.1% | -14.8% | -13.0% | 0.6% | 13.9% | 10 | 5 |
| St. Louis, MO | $1,028,596 | 10.9% | 6.4% | -1.7% | 1.7% | 4.7% | 11 | -7 |
| Tampa, FL | $1,650,875 | 15.6% | 20.8% | 27.4% | -2.9% | -0.5% | 33 | 0 |
| Virginia Beach, VA | $1,105,952 | 9.5% | -5.9% | -7.3% | -1.8% | -0.4% | 39 | 7 |
| Warren, MI | $1,052,067 | 4.5% | 17.7% | 5.6% | 28.2% | 20.5% | 22 | 1 |
| Washington, DC | $2,040,078 | 3.0% | 5.2% | 6.9% | 0.7% | 0.7% | 24 | -4 |
| West Palm Beach, FL | $4,510,196 | 1.3% | 18.5% | 9.5% | -0.6% | -5.2% | 94 | 2 |
| United States of America | $1,374,470 | 4.7% | 5.2% | 2.0% | 1.0% | 0.4% | 49 | 5 |