
- Homebuyers are getting cold feet due to high housing costs and economic uncertainty. Many are convinced they’ll be able to find a home they like better because there are so many listings on the market.
- Homebuyers are most likely to walk away in Texas and Florida, and least likely in Nassau County, NY and the Bay Area.
Roughly 53,000 U.S. home-purchase agreements were canceled in October, equal to 15.1% of homes that went under contract that month. That’s up from 14.3% a year earlier.
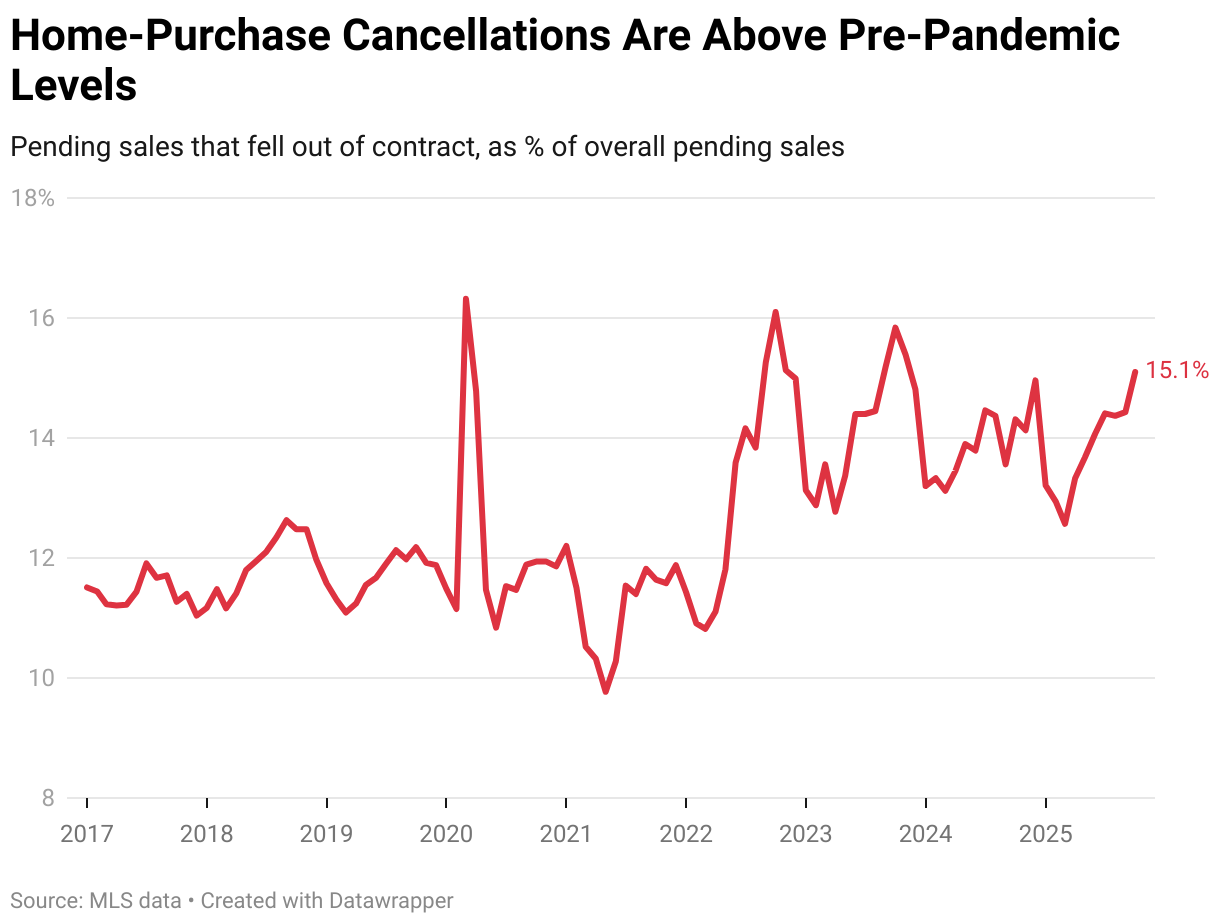
This is based on a Redfin analysis of MLS pending-sales data. The data is seasonal, which is why we compare this October to past Octobers. Please note that homes that fell out of contract during a given month didn’t necessarily go under contract the same month. For example, a home that fell out of contract in October could have gone under contract in September.
Home-purchase cancellations remain elevated for several reasons. High housing costs and economic uncertainty are giving some buyers cold feet. It’s also a buyer’s market, with home sellers significantly outnumbering homebuyers. This means buyers in most areas have room to negotiate and the flexibility to take their time; if they decide against one home, they will likely be able to find another one that meets their needs.
“Buyers know they have options, so if a seller isn’t willing to address a maintenance issue, the buyer will walk away,” said Tracy Edwards, a Redfin Premier real estate agent in Winston-Salem, NC. “A lot of sellers are having to adjust their expectations—some still think their home is worth more than the market will bear.”
Redfin agents recommend that sellers price reasonably from the get-go to limit the chances of their home sitting on the market and buyers getting cold feet.
San Antonio Has the Highest Rate of Home-Purchase Cancellations
San Antonio leads the nation in canceled deals, with over one in five (21%) pending home sales falling through in October. It’s followed by Fort Lauderdale, FL (20%), Fort Worth, TX (19.7%), Las Vegas (19.2%) and Jacksonville, FL (19.2%).
Redfin analyzed the 50 most populous U.S. metropolitan areas and included in this analysis the 47 with sufficient data.
Texas and Florida have been building more homes than anywhere else in the country, prompting some buyers to back out of deals because they’re confident they will be able to find a different home that works better for them. Some buyers in the Sunshine State are also getting cold feet due to increasing natural disasters and soaring insurance and HOA fees.
The lowest cancellation rate was in Nassau County, NY, where 4.4% of pending home sales fell through in October. Next came San Francisco (4.6%), San Jose, CA (7%), Oakland, CA (9.1%) and Montgomery County, PA (9.2%). Redfin recently reported that the Bay Area’s housing market has been heating up amid an AI boom and a return to the office.
Metro-Level Summary
| U.S. metro area | October 2025: Pending sales that fell out of contract, as % of overall pending sales | October 2024: Pending sales that fell out of contract, as % of overall pending sales |
|---|---|---|
| Anaheim, CA | 15.6% | 14.7% |
| Atlanta, GA | 18.7% | 18.1% |
| Austin, TX | 15.7% | 13.2% |
| Baltimore, MD | 14.2% | 12.0% |
| Boston, MA | 12.0% | 10.1% |
| Chicago, IL | 15.3% | 14.3% |
| Cincinnati, OH | 14.5% | 12.6% |
| Cleveland, OH | 16.6% | 16.7% |
| Columbus, OH | 17.3% | 16.6% |
| Dallas, TX | 18.0% | 16.5% |
| Denver, CO | 16.9% | 18.5% |
| Detroit, MI | 16.5% | 15.3% |
| Fort Lauderdale, FL | 20.0% | 17.5% |
| Fort Worth, TX | 19.7% | 19.3% |
| Houston, TX | 11.7% | 14.8% |
| Indianapolis, IN | 15.4% | 16.2% |
| Jacksonville, FL | 19.2% | 18.9% |
| Las Vegas, NV | 19.2% | 16.8% |
| Los Angeles, CA | 16.3% | 15.5% |
| Miami, FL | 17.6% | 16.6% |
| Milwaukee, WI | 9.2% | 9.5% |
| Minneapolis, MN | 12.5% | 11.7% |
| Montgomery County, PA | 9.2% | 9.1% |
| Nashville, TN | 16.4% | 11.7% |
| Nassau County, NY | 4.4% | 4.5% |
| New Brunswick, NJ | 10.5% | 11.0% |
| New York, NY | 9.5% | 8.1% |
| Newark, NJ | 10.7% | 9.7% |
| Oakland, CA | 9.1% | 5.2% |
| Orlando, FL | 19.1% | 18.6% |
| Philadelphia, PA | 9.9% | 11.3% |
| Phoenix, AZ | 16.9% | 17.7% |
| Pittsburgh, PA | 15.4% | 13.4% |
| Portland, OR | 17.3% | 16.1% |
| Providence, RI | 13.2% | 10.9% |
| Riverside, CA | 17.9% | 17.0% |
| Sacramento, CA | 14.4% | 13.8% |
| San Antonio, TX | 21.0% | 19.0% |
| San Diego, CA | 16.8% | 14.4% |
| San Francisco, CA | 4.6% | 3.4% |
| San Jose, CA | 7.0% | 2.5% |
| Seattle, WA | 11.9% | 10.2% |
| Tampa, FL | 19.1% | 22.2% |
| Virginia Beach, VA | 16.2% | 13.1% |
| Warren, MI | 12.5% | 10.0% |
| Washington, DC | 13.0% | 11.7% |
| West Palm Beach, FL | 14.1% | 14.1% |
| National—U.S.A. | 15.1% | 14.3% |