


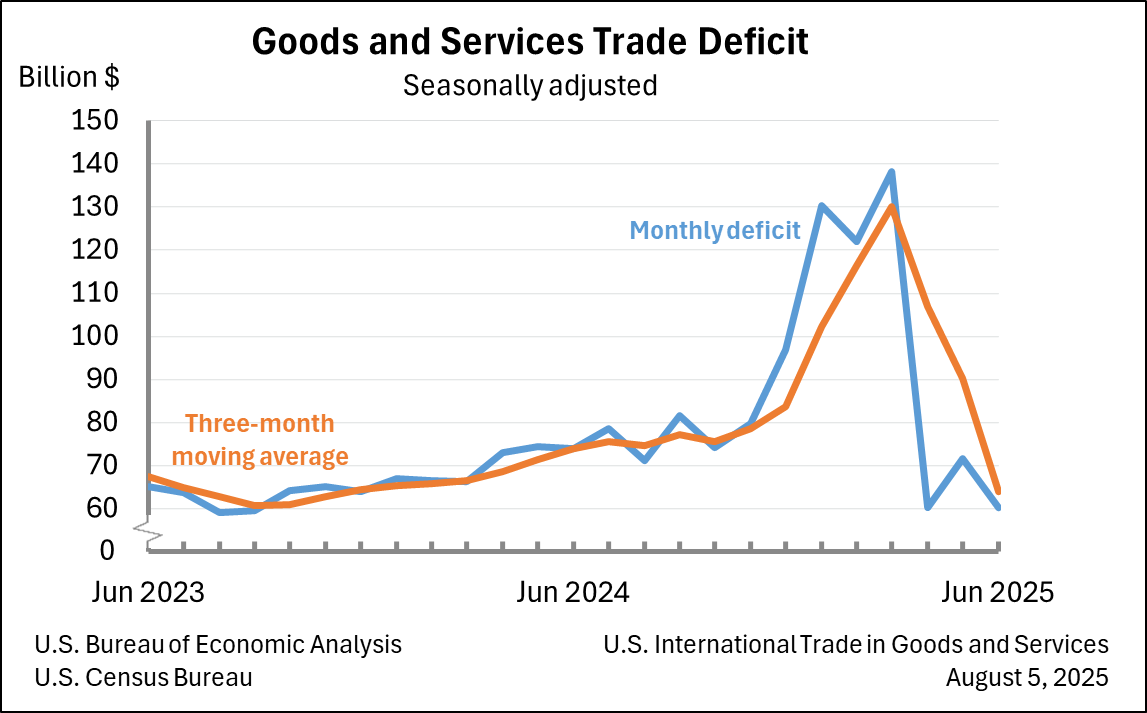
The U.S. Census Bureau and the U.S. Bureau of Economic Analysis announced today that the goods and services deficit was $60.2 billion in June, down $11.5 billion from $71.7 billion in May, revised.
| Deficit: | $60.2 Billion | –16.0%° |
| Exports: | $277.3 Billion | –0.5%° |
| Imports: | $337.5 Billion | –3.7%° |
|
Next release: Thursday, September 4, 2025 (°) Statistical significance is not applicable or not measurable. Data adjusted for seasonality but not price changes Source: U.S. Census Bureau, U.S. Bureau of Economic Analysis; U.S. International Trade in Goods and Services, August 5, 2025 |
||
Exports, Imports, and Balance (exhibit 1)
June exports were $277.3 billion, $1.3 billion less than May exports. June imports were $337.5 billion, $12.8 billion less than May imports.
The June decrease in the goods and services deficit reflected a decrease in the goods deficit of $11.4 billion to $85.9 billion and an increase in the services surplus of $0.1 billion to $25.7 billion.
Year-to-date, the goods and services deficit increased $161.5 billion, or 38.3 percent, from the same period in 2024. Exports increased $82.2 billion or 5.2 percent. Imports increased $243.7 billion or 12.1 percent.
Three-Month Moving Averages (exhibit 2)
The average goods and services deficit decreased $26.0 billion to $64.0 billion for the three months ending in June.
- Average exports decreased $1.3 billion to $282.2 billion in June.
- Average imports decreased $27.3 billion to $346.2 billion in June.
Year-over-year, the average goods and services deficit decreased $9.8 billion from the three months ending in June 2024.
- Average exports increased $15.6 billion from June 2024.
- Average imports increased $5.8 billion from June 2024.
Exports (exhibits 3, 6, and 7)
Exports of goods decreased $1.2 billion to $179.1 billion in June.
Exports of goods on a Census basis decreased $1.3 billion.
- Industrial supplies and materials decreased $4.8 billion.
- Finished metal shapes decreased $4.6 billion.
- Nonmonetary gold decreased $2.0 billion.
- Capital goods increased $2.0 billion.
- Excavating machinery increased $1.6 billion.
- Civilian aircraft increased $0.8 billion.
- Computer accessories decreased $1.2 billion.
- Consumer goods increased $1.0 billion.
- Pharmaceutical preparations increased $1.6 billion.
Net balance of payments adjustments increased $0.1 billion.
Exports of services decreased $0.2 billion to $98.2 billion in June.
- Travel decreased $0.2 billion.
Imports (exhibits 4, 6, and 8)
Imports of goods decreased $12.6 billion to $265.0 billion in June.
Imports of goods on a Census basis decreased $12.6 billion.
- Consumer goods decreased $8.4 billion.
- Pharmaceutical preparations decreased $9.6 billion.
- Industrial supplies and materials decreased $2.7 billion.
- Crude oil decreased $1.0 billion.
- Nuclear fuel materials decreased $0.4 billion.
- Other petroleum products increased $0.5 billion.
- Automotive vehicles, parts, and engines decreased $1.3 billion.
- Passenger cars decreased $1.1 billion.
Net balance of payments adjustments increased less than $0.1 billion.
Imports of services decreased $0.2 billion to $72.5 billion in June.
- Travel decreased $0.2 billion.
- Transport decreased $0.2 billion.
- Other business services increased $0.1 billion.
Real Goods in 2017 Dollars – Census Basis (exhibit 11)
The real goods deficit decreased $8.7 billion, or 9.3 percent, to $84.6 billion in June, compared to an 11.8 percent decrease in the nominal deficit.
- Real exports of goods decreased $2.2 billion, or 1.5 percent, to $145.8 billion, compared to a 0.7 percent decrease in nominal exports.
- Real imports of goods decreased $11.0 billion, or 4.5 percent, to $230.4 billion, compared to a 4.6 percent decrease in nominal imports.
Revisions
Revisions to May exports
- Exports of goods were revised up $0.1 billion.
- Exports of services were revised down $0.4 billion.
Revisions to May imports
- Imports of goods were revised down $0.1 billion.
- Imports of services were revised down $0.1 billion.
Goods by Selected Countries and Areas: Monthly – Census Basis (exhibit 19)
The June figures show surpluses, in billions of dollars, with Netherlands ($6.2), South and Central America ($4.4), United Kingdom ($2.2), Australia ($1.6), Hong Kong ($1.6), Brazil ($1.3), Saudi Arabia ($0.3), Singapore ($0.2), and Belgium ($0.1). Deficits were recorded, in billions of dollars, with Mexico ($16.3), Vietnam ($16.2), Taiwan ($12.9), European Union ($9.5), China ($9.4), Japan ($5.7), South Korea ($5.5), Ireland ($5.3), India ($5.3), Germany ($4.0), Malaysia ($3.1), Italy ($1.6), Canada ($1.3), France ($0.7), Israel ($0.1), and Switzerland (less than $0.1).
- The deficit with Ireland decreased $6.5 billion to $5.3 billion in June. Exports decreased $0.2 billion to $1.4 billion and imports decreased $6.7 billion to $6.7 billion.
- The deficit with China decreased $4.6 billion to $9.4 billion in June. Exports increased $3.1 billion to $10.1 billion and imports decreased $1.4 billion to $19.4 billion.
- The balance with Switzerland shifted from a surplus of $3.3 billion in May to a deficit of less than $0.1 billion in June. Exports decreased $2.4 billion to $4.1 billion and imports increased $0.9 billion to $4.1 billion.
All statistics referenced are seasonally adjusted; statistics are on a balance of payments basis unless otherwise specified. Additional statistics, including not seasonally adjusted statistics and details for goods on a Census basis, are available in exhibits 1-20b of this release. For information on data sources, definitions, and revision procedures, see the explanatory notes in this release. The full release can be found at www.census.gov/foreign-trade/Press-Release/current_press_release/index.html or www.bea.gov/data/intl-trade-investment/international-trade-goods-and-services. The full schedule is available in the Census Bureau’s Economic Briefing Room at www.census.gov/economic-indicators/ or on BEA’s website at www.bea.gov/news/schedule.
Next release: September 4, 2025, at 8:30 a.m. EDT
U.S. International Trade in Goods and Services, July 2025
