


By now readers will be well aware of USDi, the cryptocurrency whose price represents how many of today’s dollars you would need to buy a December 2024 dollar. (The answer at the time of this writing, according to https://usdicoin.com, is $1.044755). That construction means that USDi is inflation-proof, since as the price level increases so does its price. It is a ‘real’ dollar, always buying what a December 2024 dollar bought.
Now, I have recently pointed out that since recent NSA CPI prints were extremely high, USDi is accruing at a 12.6% rate in May and will accrue at a 10.2% rate in June. Buying a cash instrument with those yields is a no-brainer of course, and they won’t be sustained – as the energy price spike passes, future USDi yields will decline to become more normal.
But that’s a tactical call – compare USDi’s current return to 1-month TBills and allocate to whichever is higher. It’s fairly uninteresting grade school math and, anyway, not something you’d want to do with the whole nut, if you’re managing a $200mm stable portfolio. The more interesting question is about the longer-term strategic call. If you’re going to hold cash in your portfolio in some amount, and want to make an educated guess about the next year or two rather than actively move money in and out at hedge fund speeds – what’s the right ‘season’ for that? In what sorts of economic environments would you prefer to invest in an inflation-proof dollar, rather than in a dollar paying some simple nominal no-credit-risk interest rate?
The answer may surprise you, because of the recency effect. I am showing this most-recent period first for two reasons. (1) It will sync very nicely with people’s short-term memories of the last couple of years, when short-term interest rates have been above inflation, and (2) if I only show charts where USDi wins, any analyst worth his salt will assume I am hiding the bad chart. [N.b. – USDi was first launched in April 2025. But, since it is explicitly linked to the CPI index, we can easily and with complete confidence project its price backwards to any time there was a CPI index. So in these charts, I have labeled the return of “USDi” even though USDi did not exist at the time. Ergo, they are all charts about what returns would have been had USDi existed.]

The last few years have been a tale of great success for money-market investors. The Fed raised rates aggressively (finally) in 2022 and 2023, so that when we start this chart the Fed funds target rate was 5.25% and y/y CPI was 3.4%. Even though the Fed has subsequently eased rates a bit (despite inflation’s stubborn refusal to play along and fall to 2%), it was only recently that these lines started to move in parallel again as y/y CPI is 3.8% and 3-month Tbills are at 3.66%. Over the last few years, you would have lost roughly 5% holding an inflation-proof currency instead of rolling 3-month Treasury bills.
But whoa, let’s not forget the prior before that!

Here we see one solid reason to prefer an inflation-proof dollar, in that it adjusts automatically regardless of whether the central bank believes inflation to be ‘transitory.’ Ouch, this was a tough period for holders of cash. People for a long time leading up to this were holding lots of cash because precautionary cash balances are an option on future opportunities. The cost of that option – the time decay – is inflation, as I mentioned in an early podcast Ep. 18: Cash is an Option Whose Cost is Inflation. Holding cash through this period was painful: the price index (USDi) rose 18.2% versus Tbills at 6.6%, but it was really worse than that because the price level was up nearly 15% before the Fed did anything.
Speaking of the Fed, why don’t we go back to the Global Financial Crisis?

In 2005-2006, with growth strong the Fed was hiking rates. In 2007, Fed funds leveled off at 5.25% before stuff started coming unglued in the subprime mortgage market – but it was ‘contained’ – and the Fed started cutting rates. By late 2007 interest rates were at 3% but inflation was still rising. Then the bottom fell out, home prices declined, and oil prices dropped from $147/bbl to about $33/bbl. While core inflation never got below 0.6% y/y, the price index itself fell about 5% thanks to oil, leading to a lengthy period of deflation. Oh, wait…no, I guess it didn’t. As you can see from the green line, prices kept marching slowly higher – long after the Fed had collapsed interest rates to zero and were shoveling dirt on Lehman.
No need to cover every single year. But here are a couple of segments from the post-GFC period (aka ‘financial repression from the central bank’).

Inflation was low in the early ‘teens. But interest rates were even lower. The Fed felt they had a license to keep rates low, because inflation was low, and didn’t feel a need to impose positive real returns at the short end of the risk curve.
The same was true later in the decade, where the Fed responded to a growing economy by raising interest rates a little bit but still keeping them below the rate of inflation.

These periods cover lots of different economic environments, and for the last 20 years or so inflation has outperformed interest rates over a wide variety of them: the GFC collapse. Extended periods of low inflation in a period of Fed financial repression. Normal growth with a dovish central bank. The only time that it has not outperformed short rates is in a period like December 2023-March 2026, after inflation has already spiked and the Fed is belatedly trying to fix the problem by being hawkish.
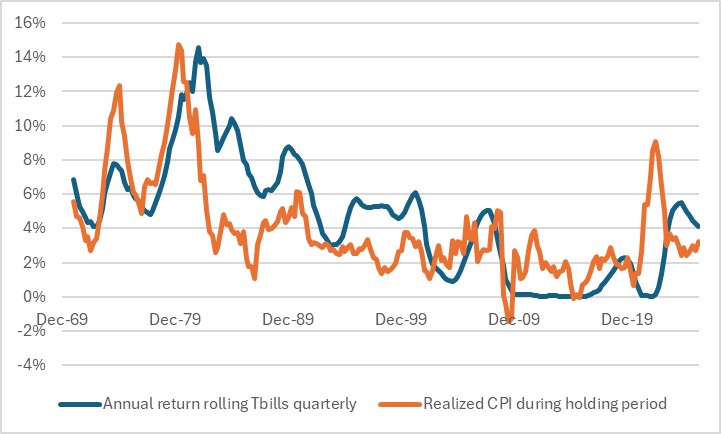
Let’s back up even further. The chart below shows the annual return from rolling 3-month Treasury bills, compared with the inflation realized during that holding period, going back to 1969. [N.b. prior to 1983, the CPI’s shelter component incorporated home prices and mortgage rates, so that by construction CPI tended to be closer to interest rates.]

You can see, looking at the chart, that there are certainly periods when interest rates do outperform inflation. Not surprisingly, these include the epoch defined by Paul Volcker and the echo of Volcker maintained by his acolytes for years. Here are the annualized after-inflation returns of Tbills (approximately), by decade:

So in the inflationary 1970s and the disinflationary 2010s and so far since 2020, it paid to hold inflation (or it would have, if USDi had existed). I would argue that what those decades had in common was a Federal Reserve that leaned towards dovish. On the other hand, the 1980s and 1990s were a great time for bondholders – not to mention equityholders – as the Fed routinely held short rates above inflation and managed to squeeze inflation out of the system to lower rates. The 2000s were a period of transition between these two, and about a wash.
Therefore, in my opinion:
In order to bet against owning USDi in preference for Tbills or other credit-risk-free cash strategically rather than tactically, you need to believe one of the following:
- Kevin Warsh is the second coming of Paul Volcker, and he will tend to keep short-term interest rates above inflation. I do believe that Warsh is one of the more hawkish-by-construction Fed Chairs we have had in a while, but notably he is hawkish on the balance sheet and more dovish on rates themselves. So…this is difficult for me to believe. Inflation also started Volcker’s term quite high, so there was a long decline where rates could be lowered and still be above inflation. We aren’t in that situation right now.
- Or, you believe it’s a close call – maybe we are finally post-GFC-crisis and can return to the model of the 2000s – and you don’t care about the portfolio benefits of having a built-in hedge in your cash holdings. Because make no mistake, if it’s a coin flip on average then I want the Dec-2020 to Dec-2023 outcome where an inflation accident gives me a long-tail benefit rather than a long-tail cost!
The season for an inflation-proof currency is now.
