
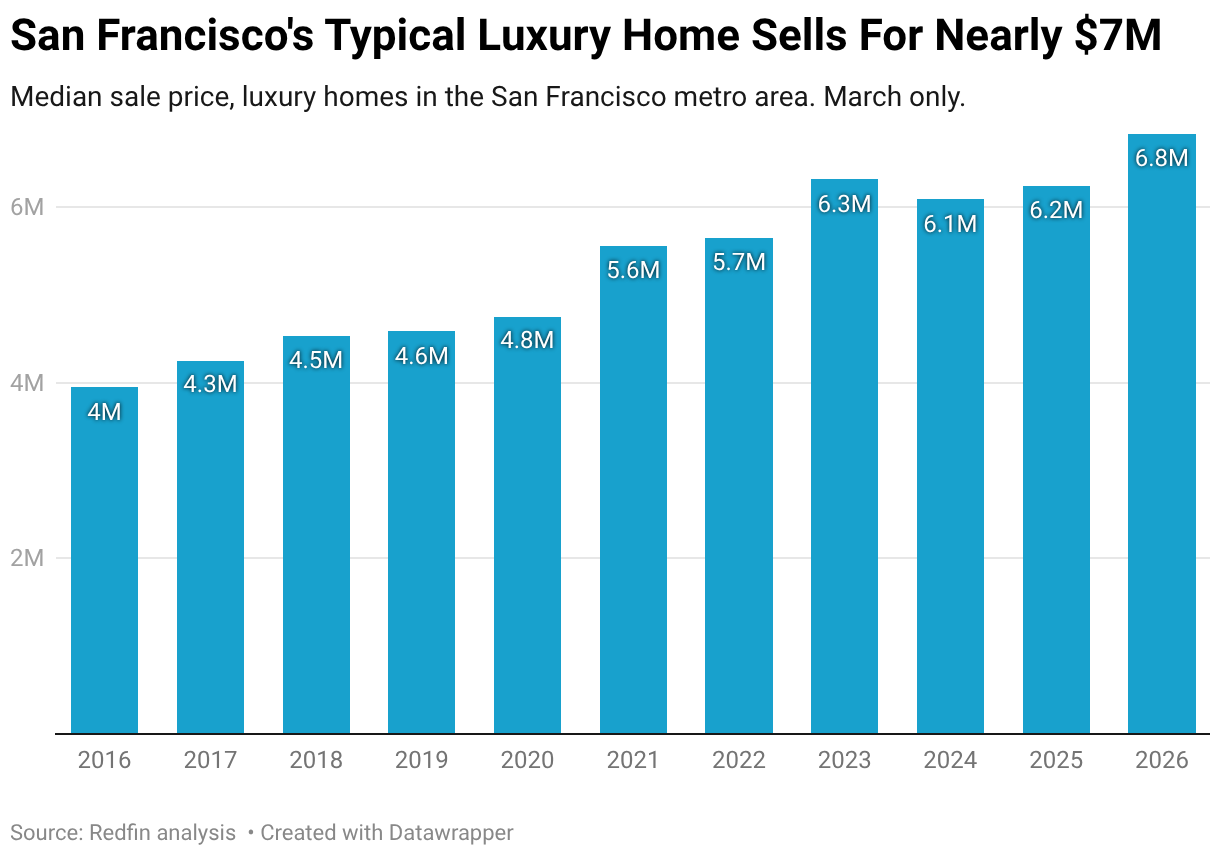
- Luxury home sales are surging in San Francisco, the epicenter of the AI boom, pushing the median sale price to the highest March level on record.
- Tight supply is another factor pushing up San Francisco’s luxury prices; active listings are down roughly 15% year over year.
- San Francisco’s luxury housing market is greatly outperforming the U.S. as a whole; nationwide, luxury sales are down 2% and price growth is losing steam.
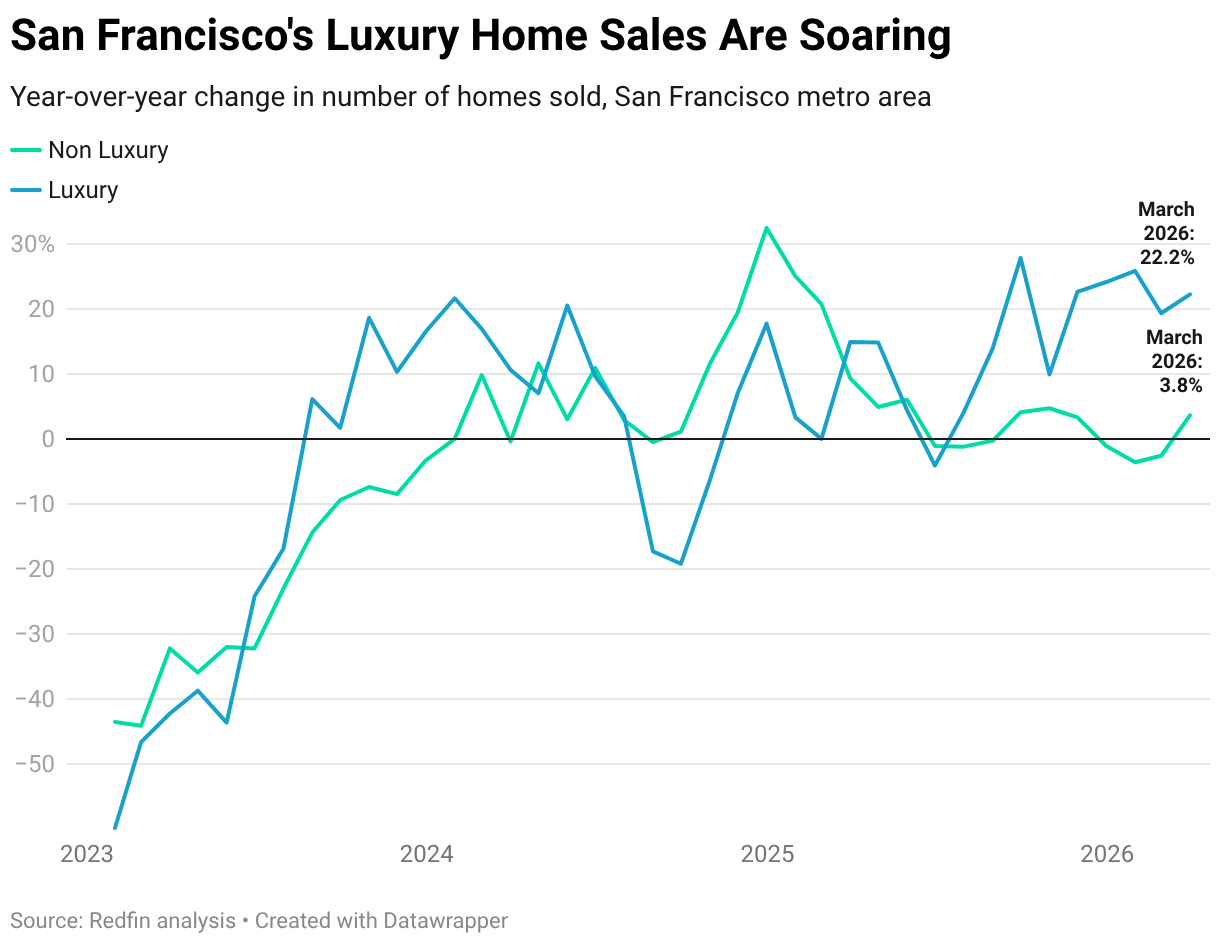
San Francisco’s luxury housing market is booming.
The number of luxury homes sold in San Francisco jumped 22.2% year over year in March, the fifth straight month of double-digit increases and the third-biggest increase among the 50 most populous U.S. metros. That compares with a 3.8% uptick for non luxury homes.
This is based on a Redfin analysis of MLS home sales from January 2026 through March 2026, which we refer to as “March” throughout this report. All figures cover rolling three-month periods. Redfin defines luxury homes as those in the top 5% of their metro area’s price range, while non-luxury homes fall into the 35th–65th percentile. This data is subject to revision.
Soaring demand for San Francisco’s high-end homes have pushed the median luxury sale price to $6,808,561, the highest level for this time of year on record. That’s up 9% year over year; for comparison, non luxury prices are essentially unchanged (+0.1%).
The typical high-end home in San Francisco went under contract in 12 days, the fastest of all the major U.S. metros and down from 28 days a year earlier. Non luxury homes also sold quickly, going under contract in a median of 15 days, down from 19.
A separate Redfin report found that sale prices are surging in San Francisco’s overall housing market. The jump in luxury prices is a major driver
The jump in San Francisco’s luxury prices is driving a big across-the-board price increase for the Bay Area metro.
There are a few key reasons for San Francisco’s luxury housing surge:
- Artificial intelligence. San Francisco is the epicenter of the AI boom. Residents who work at AI companies typically earn much more money than those who work at other tech companies; reports say OpenAI and Anthropic pay a base salary that’s $40,000-$85,000 more than comparable jobs elsewhere–and that’s before bonuses and stocks. Many AI workers are getting huge bonuses.
- Supply shortage. The total number of luxury homes for sale in San Francisco fell 15.2% year over year in March, capping off two straight years of declines and digging the inventory hole deeper. Note that new listings of luxury homes are up 15% year over year as high-end sellers try to cash in on demand.
- Competition. Tight supply has led to competition for the luxury homes that are on the market, which drives up prices. Nearly two-thirds (62.4%) of the city’s luxury homes that sold in March sold within two weeks, up from 44.6% a year earlier and the highest share in records dating back to 2013.
Local Redfin Premier agent Ali Mafi said that while AI compensation is a huge contributor to San Francisco’s luxury boom, there are also other drivers.
“There was this hysteria a few years ago that people were leaving San Francisco in droves and the housing market was going to crash. That wasn’t true then and it’s the opposite of true now,” Mafi said. “While some people left during the pandemic, many of those people are now coming back after realizing they don’t actually want to live in whatever state they moved to. Plus, there’s a whole new pool of AI employees. They’re bringing so much money into the housing market— especially the luxury market. The recent dip in mortgage rates has attracted even more buyers, and some luxury properties are now getting dozens of offers.”
|
March 2026 Market Summary: San Francisco Metro Area |
||
|---|---|---|
| Luxury |
Non Luxury |
|
|
Median sale price |
$6,808,561 | $1,497,373 |
|
Median sale price, YoY change |
9% |
0.1% |
|
Pending home sales, YoY change |
22.7% | 18.1% |
|
Homes sold, YoY change |
22.2% | 3.8% |
| New listings, YoY change | 15% |
16.4% |
| Active listings, YoY change | -15.2% |
4.1% |
| Median days on market | 12 |
15 |
| Median days on market, YoY change | -16 |
-4 |
Nationwide, Luxury Home Prices Post Slowest Growth in 5 Years
The U.S. luxury housing market is lackluster–especially compared to San Francisco’s luxury market.
U.S. luxury home sales fell 2.4% year over year in March, and non luxury sales fell 0.2%.
The median U.S. luxury sale price was $1,395,456, up 3.6% year over year—the slowest growth in five years. That’s compared with a 1% increase for non luxury homes, which was the slowest growth on record.
The total number of luxury homes for sale (active listings) ticked up 1.5% year over year, half the 3.1% increase for their non luxury counterparts. Luxury new listings fell 1.3%, comparable with the decline for non luxury new listings.
The nation’s luxury market is largely mirroring the overall market, with tepid demand and slow price growth. Many would-be homebuyers, whether they’re high-end buyers or not, are sitting on the sidelines due to 6%-plus mortgage rates and widespread economic uncertainty, including the back-and-forth on the Iran war.
|
March 2026 Luxury Market Summary: United States |
||
|---|---|---|
| Luxury |
Non Luxury |
|
| Median sale price | $1,395,457 |
$376,298 |
|
Median sale price, YoY change |
3.6% | 1% |
| Pending home sales, YoY change | 0.3% |
3.2% |
|
Homes sold, YoY change |
-2.4% | -0.2% |
| New listings, YoY change | -1.3% |
-1% |
|
Active listings, YoY change |
1.5% | 3.1% |
| Median days on market | 73 |
58 |
| Median days on market, YoY change | +6 |
+6 |
Other Metro-Level Luxury Highlights: March 2026
Redfin’s metro-level luxury data includes the 50 most populous U.S. metros. All changes below are year over year.
- Prices: Luxury prices rose most in Tampa, FL (16%), Philadelphia (15.8%) and Kansas City, MO (15.6%). They fell in just one metro: Denver (-1.5%).
- Pending sales: Luxury pending sales rose most in Tampa (45.4%), San Francisco (23.6%) and Detroit (20.9%). They fell most in Nassau County, NY (-33.7%), Los Angeles (-21.9%) and Providence, RI (-21.4%).
- Closed home sales: Luxury home sales rose most in Tampa (62.3%), Detroit (29.1%) and San Francisco (22.2%). They fell most in Cincinnati (-27.2%), Providence, RI (-25.7%) and Los Angeles (-24.5%).
- New listings: Luxury new listings rose most in Detroit (29.9%), St. Louis (23.9%) and Tampa (22.2%). They fell most in Los Angeles (-24.4%), New York (-22.8%) and Nassau County, NY (-20.1%).
- Active listings: Luxury active listings rose most in Detroit (34.2%), Tampa (20.9%) and Atlanta (18.3%). They fell most in Anaheim, CA (-25.8%), New York (-17.3%) and San Jose, CA (-16.4%).
- Median days on market: Luxury homes sold fastest in San Francisco (12 days), Tampa (13) and San Jose, CA (14). They sold slowest in Miami (140), Nashville, TN (129) and San Antonio (109).
Full Metro-Level Luxury Data: March 2026
The table below includes the 50 most populous U.S. metropolitan areas. Luxury homes are defined as those estimated to be in the top 5% of their respective metro area based on prices of homes sold over a rolling 12-month period.
| Region Name | Median sale price | Median sale price, YoY change | Pending sales, YoY change | Homes sold, YoY change | New listings, YoY change | Active listings, YoY change |
| Anaheim, CA | $5,476,519 | 7.0% | -20.7% | -17.4% | -16.9% | -25.8% |
| Atlanta, GA | $1,441,139 | 6.8% | 5.0% | -5.9% | 19.9% | 18.3% |
| Austin, TX | $1,847,561 | 10.2% | -20.1% | -9.2% | -5.8% | -6.3% |
| Baltimore, MD | $1,305,114 | 2.8% | -16.3% | -10.6% | -19.6% | -8.3% |
| Boston, MA | $2,856,202 | 3.4% | -11.3% | -9.7% | -6.2% | -3.0% |
| Charlotte, NC | $1,656,825 | 4.6% | -4.6% | -18.8% | 5.6% | 6.9% |
| Chicago, IL | $1,547,599 | 8.0% | 3.9% | -16.2% | -12.3% | -16.4% |
| Cincinnati, OH | $960,967 | 3.0% | -4.6% | -27.2% | -8.5% | -6.7% |
| Cleveland, OH | $848,894 | 11.3% | -2.9% | -0.5% | 8.1% | -4.1% |
| Columbus, OH | $1,022,826 | 6.2% | 0.9% | -11.5% | 7.6% | 1.4% |
| Dallas, TX | $1,595,498 | 1.9% | 2.2% | -5.1% | 6.8% | 9.2% |
| Denver, CO | $1,941,151 | -1.5% | -3.1% | -4.7% | 1.3% | 4.5% |
| Detroit, MI | $721,202 | 0.7% | 20.9% | 29.1% | 29.9% | 34.2% |
| Fort Worth, TX | $1,241,672 | 5.5% | 9.3% | 9.4% | -4.8% | 3.0% |
| Houston, TX | $1,355,254 | 5.4% | -7.0% | -1.8% | -2.3% | 1.0% |
| Indianapolis, IN | $993,338 | 8.6% | -5.4% | 4.6% | -8.1% | -2.8% |
| Jacksonville, FL | $1,581,983 | 1.4% | 6.1% | 9.4% | -6.8% | -8.1% |
| Kansas City, MO | $1,138,414 | 15.6% | -1.6% | 16.8% | 3.6% | -4.0% |
| Las Vegas, NV | $1,707,138 | 14.0% | 0.6% | -4.4% | -11.8% | 0.3% |
| Los Angeles, CA | $4,499,037 | 7.3% | -21.9% | -24.5% | -24.4% | -14.9% |
| Miami, FL | $4,991,798 | 11.5% | 20.3% | 8.2% | -15.3% | -13.1% |
| Milwaukee, WI | $1,142,863 | 7.3% | 0.5% | -14.8% | -5.2% | -11.7% |
| Minneapolis, MN | $1,266,589 | 4.6% | -21.3% | -20.1% | -9.1% | -3.8% |
| Montgomery County, PA | $1,595,170 | 10.7% | -12.2% | -13.3% | 0.6% | 4.2% |
| Nashville, TN | $2,247,683 | 10.6% | -3.7% | 1.5% | -4.8% | 9.1% |
| Nassau County, NY | $2,700,682 | 5.9% | -33.7% | 1.1% | -20.1% | -12.8% |
| New Brunswick, NJ | $2,147,113 | 3.0% | -16.7% | -18.1% | -6.9% | -4.3% |
| New York, NY | $4,304,556 | 4.6% | -10.2% | -7.3% | -22.8% | -17.3% |
| Newark, NJ | $2,111,304 | 8.1% | -8.3% | -18.8% | -12.0% | -9.0% |
| Oakland, CA | $3,082,663 | 2.2% | -11.7% | 2.1% | -9.6% | -16.3% |
| Orlando, FL | $1,430,172 | 3.3% | -14.6% | -16.1% | -16.1% | -10.1% |
| Philadelphia, PA | $1,420,131 | 15.8% | 6.2% | -2.8% | -3.9% | -7.1% |
| Phoenix, AZ | $2,243,794 | 10.4% | 8.0% | 2.9% | -4.9% | 2.6% |
| Pittsburgh, PA | $899,129 | 4.2% | 3.4% | 0.0% | 2.6% | 6.6% |
| Portland, OR | $1,479,269 | 0.8% | 8.7% | 16.7% | 14.7% | 0.9% |
| Providence, RI | $1,736,589 | 5.5% | -21.4% | -25.7% | -13.7% | 1.8% |
| Riverside, CA | $1,728,612 | 2.9% | -8.2% | -12.2% | -15.2% | -11.7% |
| Sacramento, CA | $1,742,045 | 4.6% | 1.0% | -3.9% | 2.6% | 6.1% |
| San Antonio, TX | $985,858 | 6.1% | -10.5% | -11.2% | 0.5% | 0.8% |
| San Diego, CA | $3,773,734 | 4.7% | -1.1% | -3.1% | -14.5% | -11.1% |
| San Francisco, CA | $6,808,561 | 9.0% | 23.6% | 22.2% | 15.0% | -15.2% |
| San Jose, CA | $5,596,628 | 0.3% | -0.8% | -11.2% | 3.4% | -16.4% |
| Seattle, WA | $2,964,408 | 0.1% | -13.6% | -18.4% | 7.1% | 10.5% |
| St. Louis, MO | $1,036,007 | 15.4% | 5.0% | 0.0% | 23.9% | 15.5% |
| Tampa, FL | $1,644,620 | 16.0% | 45.4% | 62.3% | 22.2% | 20.9% |
| Virginia Beach, VA | $1,087,287 | 5.2% | -12.0% | 0.0% | 1.1% | -9.9% |
| Warren, MI | $1,111,046 | 14.1% | -5.6% | -16.4% | 9.2% | 3.1% |
| Washington, DC | $2,066,762 | 4.7% | -3.2% | -14.7% | -2.2% | 0.6% |
| West Palm Beach, FL | $4,485,829 | 13.5% | 15.5% | 1.4% | -5.3% | -2.8% |
| National | $1,395,456 | 3.6% | 0.3% | -2.4% | -1.3% | 1.5% |