
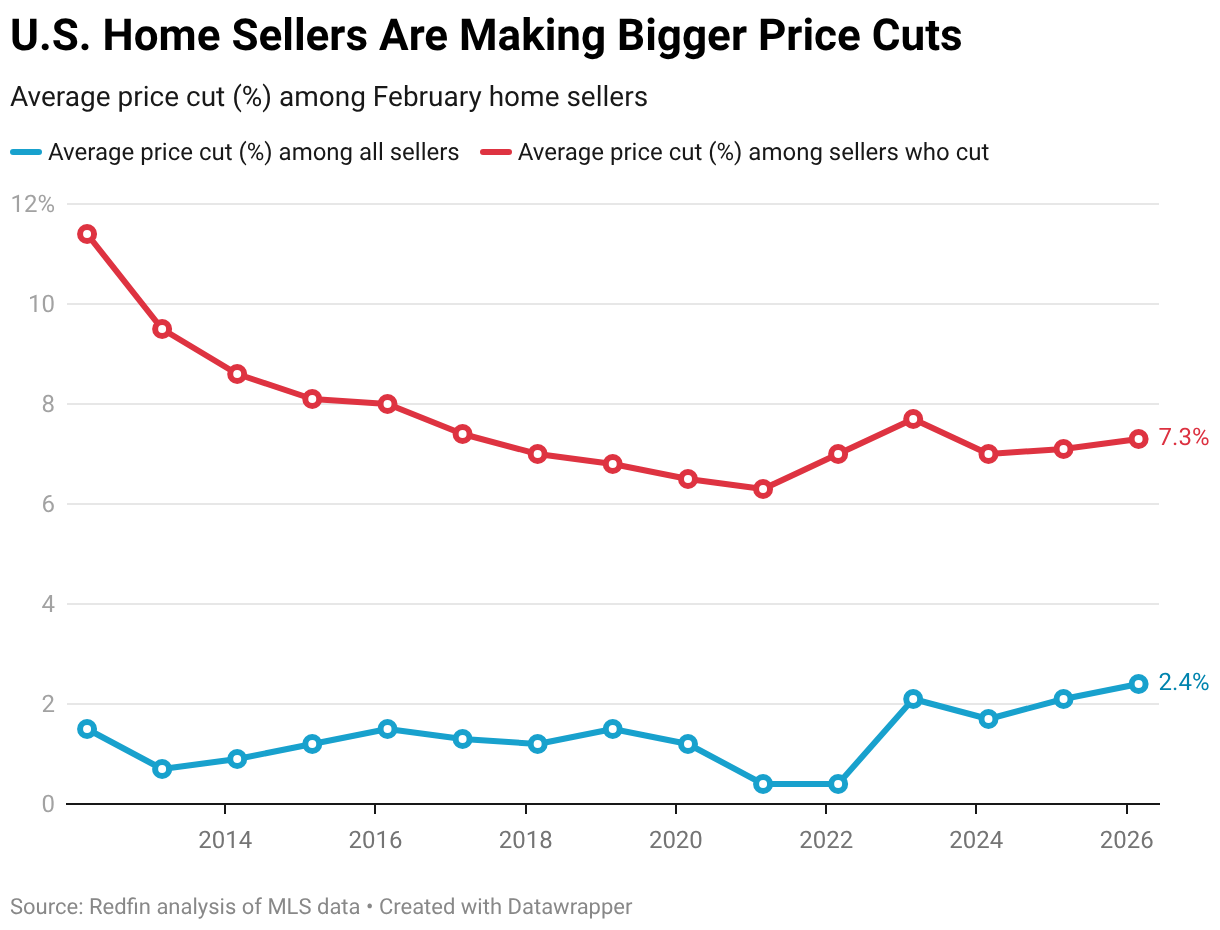
- February home sellers who cut their price lowered it by $41,000, on average, or 7.3%.
- Home sellers in Texas and Florida were most likely to make price cuts, while sellers in the Bay Area were least likely.
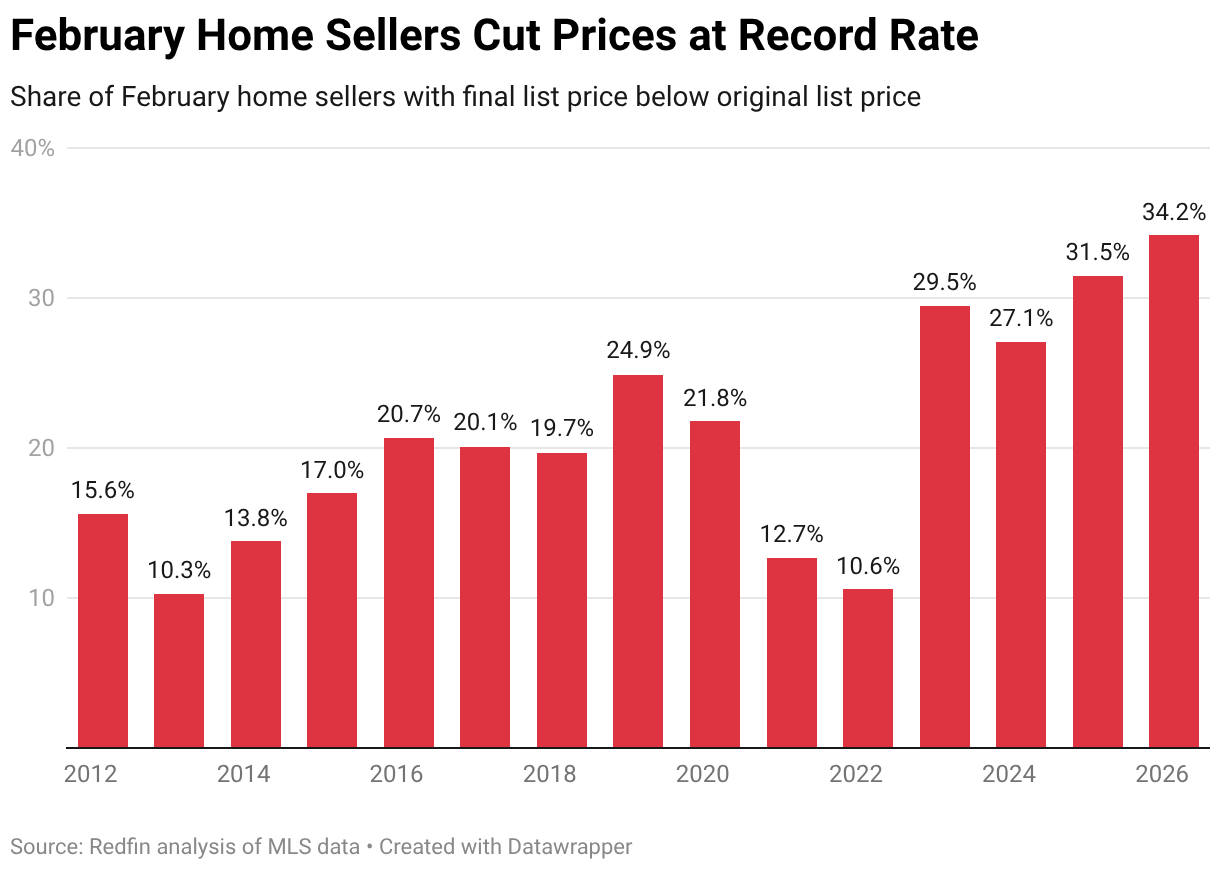
More than one-third (34.2%) of February home sellers lowered their list price. That’s up from 31.5% a year earlier and represents the highest February share in records dating back to 2012.
February home sellers who lowered their list price cut it by an average of $40,915, or 7.3%—the highest February percentage since 2023.
Among all February home sellers (not just those who reduced their price), the average price cut was $13,463, or 2.4%—the highest February percentage on record.
This is based on a Redfin analysis that compares original list prices to final list prices in U.S. MLS home-sale records. While this analysis measures closed home sales only, it does not measure final sale prices, which in some cases include additional price reductions based on negotiations with buyers. Click here to see our separate analysis comparing original list prices to final sale prices.
Price cuts are on the rise because it’s a buyer’s market. There are hundreds of thousands more home sellers in the market than buyers because buyers have been spooked by high mortgage rates, high prices and economic uncertainty. When sellers outnumber buyers, buyers can often negotiate on price because they have a lot of options to choose from. Allowing sellers to pre-market their homes before putting them on the MLS can help them price more accurately, reducing the chances of a price cut.
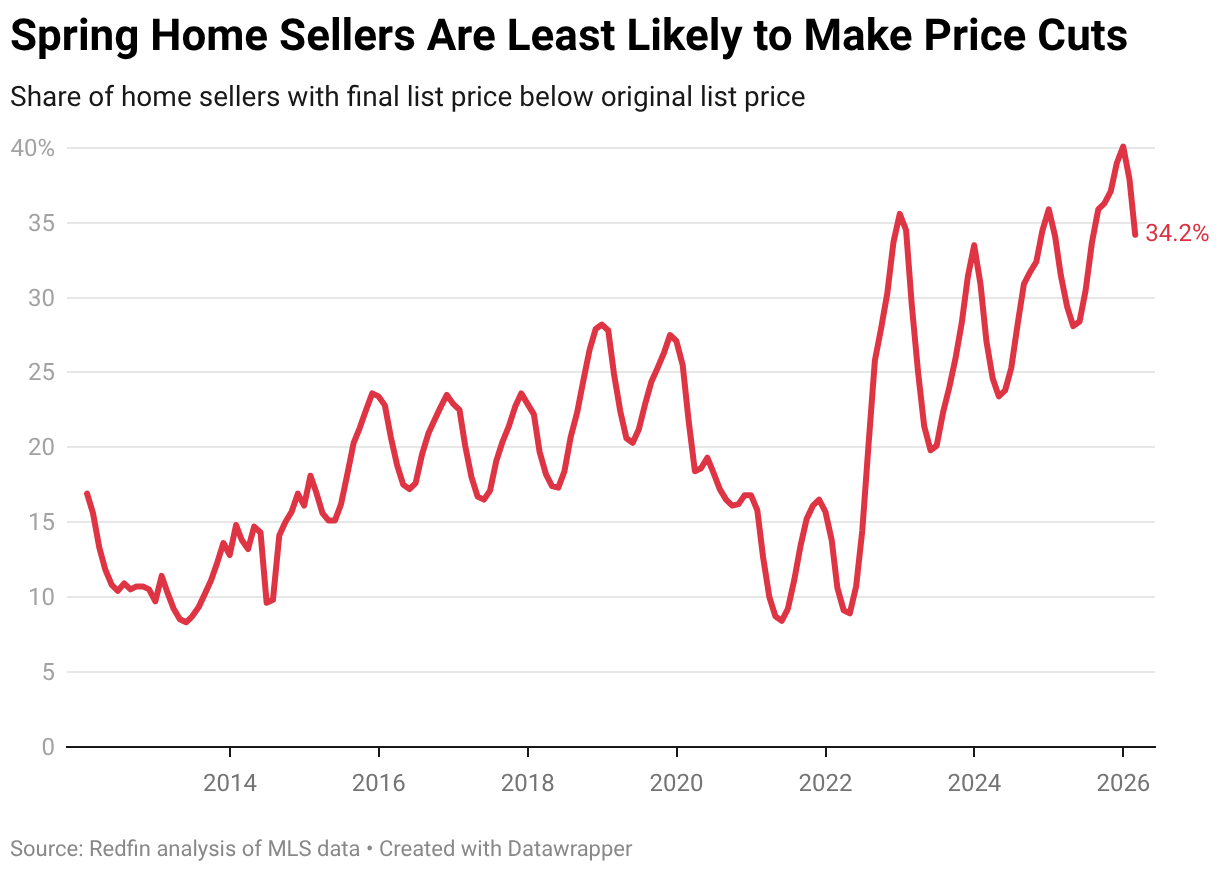
Springtime Is the Best Time to Sell a Home Without a Price Cut
We compare February 2026 to prior Februarys because price-cut data is seasonal, but this masks seasonal trends that prospective sellers should be aware of. Sellers who seal the deal in springtime, which recently began, are the least likely to face a price cut. Sellers who close in the winter—specifically December—are most likely to face a price cut.
In six of the past 10 years, May was the month with the lowest share of price cuts. April had the lowest share in three of the past 10 years, including 2024 and 2025.
“A lot of people who couldn’t sell their homes last year opted to delist instead of reducing the price, with a plan to relist this spring because they knew that would give them a better chance of selling,” said Aditi Jain, a Redfin Premier real estate agent in Boston. “The Boston market is very different in spring versus fall. Some homeowners need to move immediately, but those who can afford to time the market may get a better price.”
Redfin reported last month that relistings are on the rise as home sellers bet on a stronger spring market; nearly 45,000 U.S. homes that were delisted last year were relisted for sale in January 2026—the highest January figure in records dating back to 2016.
It’s worth noting that this analysis doesn’t include price cuts that happened prior to a relisting, meaning the share of home sellers who cut their price may be even higher than reported. For example, if a seller lowered the list price of their home in September, delisted it in October and then relisted it in February, the September price cut wouldn’t be reflected in the aforementioned statistic about 34.2% of home sellers cutting their price.
Sellers Who Have Been In Their Homes a Long Time Are Less Likely to Cut Prices
The longer someone owns their home, the lower the chances of a price cut. Less than one-third (31.8%) of February 2026 sellers who had been in their home for at least seven years lowered their price. That compares with 34.9% of sellers who had been in their home for two to seven years, and 37.4% of sellers who had been in their home for zero to two years.
Many people who bought homes in the past seven years bought during the peak of the pandemic market when home prices were soaring. In a lot of areas, prices have since come down, meaning sellers are at risk of being underwater. Many of these sellers price high initially in an attempt to recoup their investment, only to find they must lower their expectations because the market has adjusted.
Home Sellers In Texas and Florida Are Most Likely to Cut Their Price
In San Antonio, 57.9% of February home sellers lowered their list price—the highest share among the 50 most populous U.S. metropolitan areas. Next came Austin, TX (55.2%), Dallas (47.3%), Tampa, FL (45.9%) and Fort Lauderdale, FL (44.9%).
Texas and Florida are home to some of the nation’s strongest buyer’s markets in part because they have been building more homes than other states. That has given buyers options, and thus, bargaining power. Florida is also grappling with intensifying natural disasters, soaring insurance premiums and rising condo HOA fees, which has prompted some homeowners to leave.
Home Sellers In the Bay Area Are Least Likely to Cut Their Price
Home sellers were least likely to reduce their price in San Francisco, where 7.4% of February home sales included price cuts. Next came San Jose, CA (11.1%), Newark, NJ (12.9%), Oakland, CA (14.3%) and Seattle (18.4%).
Bay Area home sellers are known for underpricing their homes to fuel bidding wars, which lowers the chances of a seller having to cut their price.
Metro-Level Data: February 2026
The table below includes the 50 most populous U.S. metro areas.
| U.S. metro area | Share of home sales with a price cut | Average price cut among sellers who cut prices (%) | Average price cut among sellers who cut prices ($) | Average price cut (%) among all sellers | Average price cut ($) among all sellers |
|---|---|---|---|---|---|
| Anaheim, CA | 20.7% | 6.0% | $142,463 | 1.1% | $27,949 |
| Atlanta, GA | 34.0% | 6.4% | $29,845 | 2.1% | $9,889 |
| Austin, TX | 55.2% | 9.1% | $54,685 | 4.9% | $29,669 |
| Baltimore, MD | 31.4% | 7.3% | $31,765 | 2.0% | $9,063 |
| Boston, MA | 20.6% | 6.5% | $57,426 | 1.2% | $11,352 |
| Charlotte, NC | 42.6% | 6.8% | $35,792 | 2.8% | $14,497 |
| Chicago, IL | 21.3% | 6.2% | $23,677 | 1.3% | $4,929 |
| Cincinnati, OH | 28.8% | 5.7% | $21,866 | 1.6% | $6,199 |
| Cleveland, OH | 30.2% | 7.6% | $20,641 | 2.3% | $6,157 |
| Columbus, OH | 37.9% | 6.7% | $26,213 | 2.5% | $9,702 |
| Dallas, TX | 47.3% | 7.7% | $41,995 | 3.6% | $19,645 |
| Denver, CO | 33.4% | 6.7% | $50,088 | 2.2% | $16,405 |
| Detroit, MI | 29.0% | 9.3% | $17,139 | 2.7% | $5,076 |
| Fort Lauderdale, FL | 44.9% | 7.6% | $42,284 | 3.4% | $18,738 |
| Fort Worth, TX | 43.2% | 6.8% | $31,149 | 2.9% | $13,269 |
| Houston, TX | 38.4% | 7.9% | $33,754 | 2.5% | $11,583 |
| Indianapolis, IN | 42.5% | 6.9% | $24,387 | 2.8% | $10,078 |
| Jacksonville, FL | 44.6% | 7.2% | $33,907 | 3.1% | $14,864 |
| Kansas City, MO | 30.7% | 6.7% | $27,318 | 1.9% | $7,665 |
| Las Vegas, NV | 34.5% | 5.4% | $36,811 | 1.8% | $12,225 |
| Los Angeles, CA | 24.0% | 7.0% | $117,727 | 1.5% | $26,478 |
| Miami, FL | 43.1% | 8.2% | $125,131 | 3.4% | $53,511 |
| Milwaukee, WI | 20.3% | 7.1% | $24,304 | 1.3% | $4,449 |
| Minneapolis, MN | 27.0% | 5.7% | $25,386 | 1.5% | $6,614 |
| Montgomery County, PA | 24.7% | 6.4% | $41,822 | 1.4% | $9,483 |
| Nashville, TN | 31.7% | 6.0% | $41,600 | 1.8% | $12,859 |
| Nassau County, NY | 21.2% | 7.0% | $88,472 | 1.4% | $17,904 |
| New Brunswick, NJ | 23.9% | 6.8% | $37,353 | 1.6% | $8,526 |
| New York, NY | 27.2% | 7.7% | $217,417 | 1.9% | $55,942 |
| Newark, NJ | 12.9% | 6.6% | $48,078 | 0.7% | $5,751 |
| Oakland, CA | 14.3% | 6.3% | $60,579 | 0.8% | $7,521 |
| Orlando, FL | 43.4% | 7.0% | $38,269 | 3.0% | $16,269 |
| Philadelphia, PA | 34.7% | 8.5% | $42,136 | 2.7% | $13,810 |
| Phoenix, AZ | 42.8% | 6.2% | $45,190 | 2.5% | $18,695 |
| Pittsburgh, PA | 37.8% | 9.0% | $24,569 | 3.2% | $8,801 |
| Portland, OR | 36.2% | 6.5% | $44,422 | 2.3% | $15,786 |
| Providence, RI | 19.9% | 6.2% | $44,090 | 1.1% | $8,398 |
| Riverside, CA | 32.7% | 6.4% | $51,166 | 2.0% | $16,133 |
| Sacramento, CA | 26.0% | 5.6% | $46,337 | 1.3% | $11,464 |
| San Antonio, TX | 57.9% | 8.7% | $32,909 | 4.9% | $18,686 |
| San Diego, CA | 22.0% | 5.9% | $77,416 | 1.1% | $14,872 |
| San Francisco, CA | 7.4% | 7.7% | $142,836 | 0.4% | $7,777 |
| San Jose, CA | 11.1% | 6.8% | $152,108 | 0.6% | $13,831 |
| Seattle, WA | 18.4% | 6.0% | $51,842 | 1.1% | $9,243 |
| St. Louis, MO | 29.5% | 7.7% | $21,062 | 2.1% | $5,765 |
| Tampa, FL | 45.9% | 8.2% | $41,279 | 3.7% | $18,653 |
| Virginia Beach, VA | 21.5% | 4.9% | $20,698 | 1.0% | $4,047 |
| Warren, MI | 28.1% | 6.7% | $23,356 | 1.8% | $6,189 |
| Washington, DC | 27.0% | 6.1% | $45,032 | 1.6% | $11,631 |
| West Palm Beach, FL | 42.3% | 9.1% | $95,559 | 3.8% | $38,893 |