Real gross domestic product (GDP) increased at an annual rate of 0.5 percent in the fourth quarter of 2025 (October, November, and December), according to the third estimate released today by the U.S. Bureau of Economic Analysis. In the third quarter of 2025, real GDP increased 4.4 percent.
The third report for the fourth quarter of 2025, originally scheduled for March 27, 2026, was rescheduled due to the October–November 2025 government shutdown.
Real GDP was revised down 0.2 percentage point from the second estimate, primarily reflecting a downward revision to investment. For more information, refer to the “Technical Notes” below.
, Industries, Corporate Profits, State GDP, and State Personal Income, 4th Quarter and Year 2025")
The contributors to the increase in real GDP in the fourth quarter were increases in consumer spending and investment. These movements were partly offset by decreases in government spending and exports. Imports, which are a subtraction in the calculation of GDP, decreased.
GDP by industry
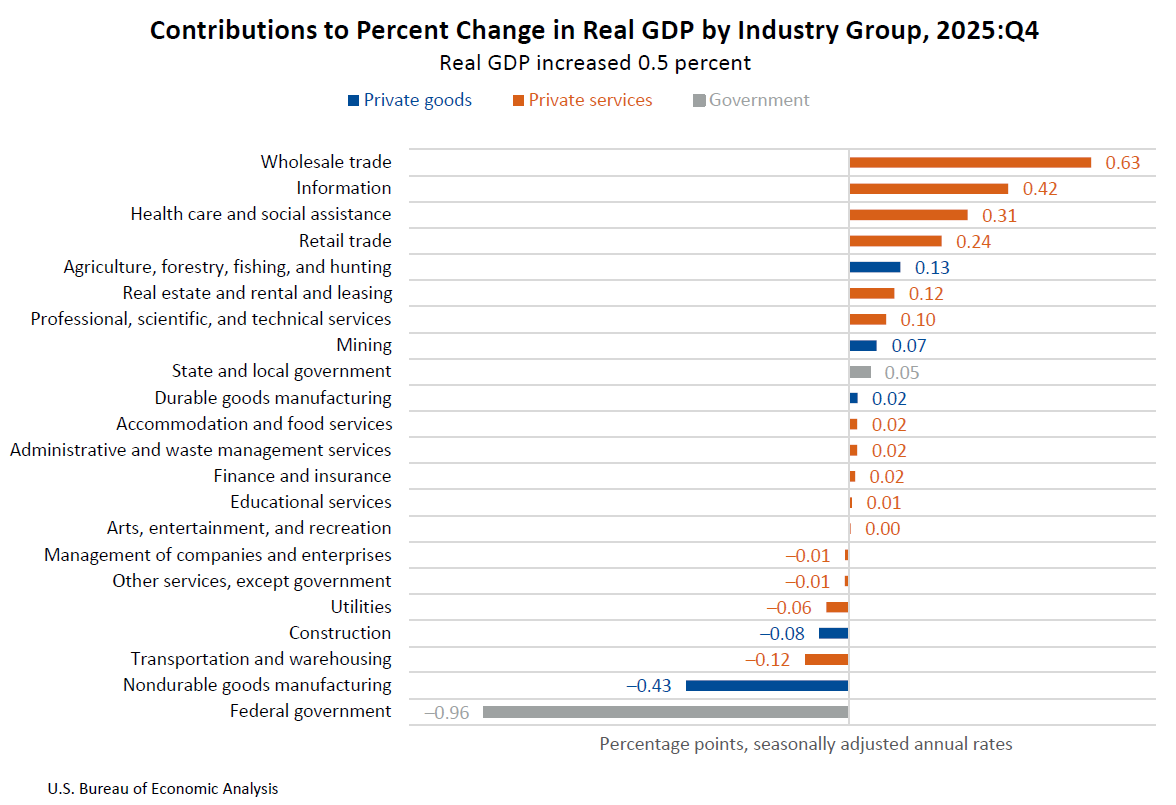
From an industry perspective, the increase in real GDP reflected an increase of 2.3 percent in real value added for private services-producing industries that was partly offset by decreases of 7.8 percent in government and 1.8 percent in private goods-producing industries. The leading industry contributors to the increase in real GDP were wholesale trade, information, and health care and social assistance.
Related economic measures
Real final sales to private domestic purchasers, the sum of consumer spending and gross private fixed investment, increased 1.8 percent in the fourth quarter, revised down 0.1 percentage point from the previous estimate.
Real gross output decreased 0.5 percent in the fourth quarter, reflecting decreases of 3.2 percent for private goods-producing industries and 4.7 percent for government that were partly offset by an increase of 1.1 percent for private services-producing industries.
Real gross domestic income (GDI) increased 2.6 percent in the fourth quarter, compared with an increase of 3.5 percent in the third quarter. The average of real GDP and real GDI increased 1.5 percent in the fourth quarter, compared with 4.0 percent in the third quarter.
Profits from current production (corporate profits with inventory valuation and capital consumption adjustments) increased $246.9 billion in the fourth quarter, compared with an increase of $175.6 billion in the third quarter.
The price index for gross domestic purchases increased 3.7 percent in the fourth quarter, revised down 0.1 percentage point from the previous estimate. The personal consumption expenditures (PCE) price index increased 2.9 percent, and the PCE price index excluding food and energy increased 2.7 percent, both the same as previously estimated.
| Real GDP and Related Measures | ||||
|---|---|---|---|---|
| [Percent change (SAAR) from 2025:Q3 to 2025:Q4] | ||||
| Advance Estimate | Second Estimate | Third Estimate | ||
| Real GDP | 1.4 | 0.7 | 0.5 | |
| Current-dollar GDP | 5.1 | 4.5 | 4.2 | |
| Real final sales to private domestic purchasers | 2.4 | 1.9 | 1.8 | |
| Real GDI | … | … | 2.6 | |
| Average of real GDP and real GDI | … | … | 1.5 | |
| Gross domestic purchases price index | 3.7 | 3.8 | 3.7 | |
| PCE price index | 2.9 | 2.9 | 2.9 | |
| PCE price index excluding food and energy | 2.7 | 2.7 | 2.7 | |
| U.S. Bureau of Economic Analysis | ||||
GDP by state
From a regional perspective, real GDP increased in 35 states in the fourth quarter of 2025, with the percent change at an annual rate ranging from 3.8 percent in North Dakota to –8.3 percent in the District of Columbia and remaining unchanged in Indiana and Maine.
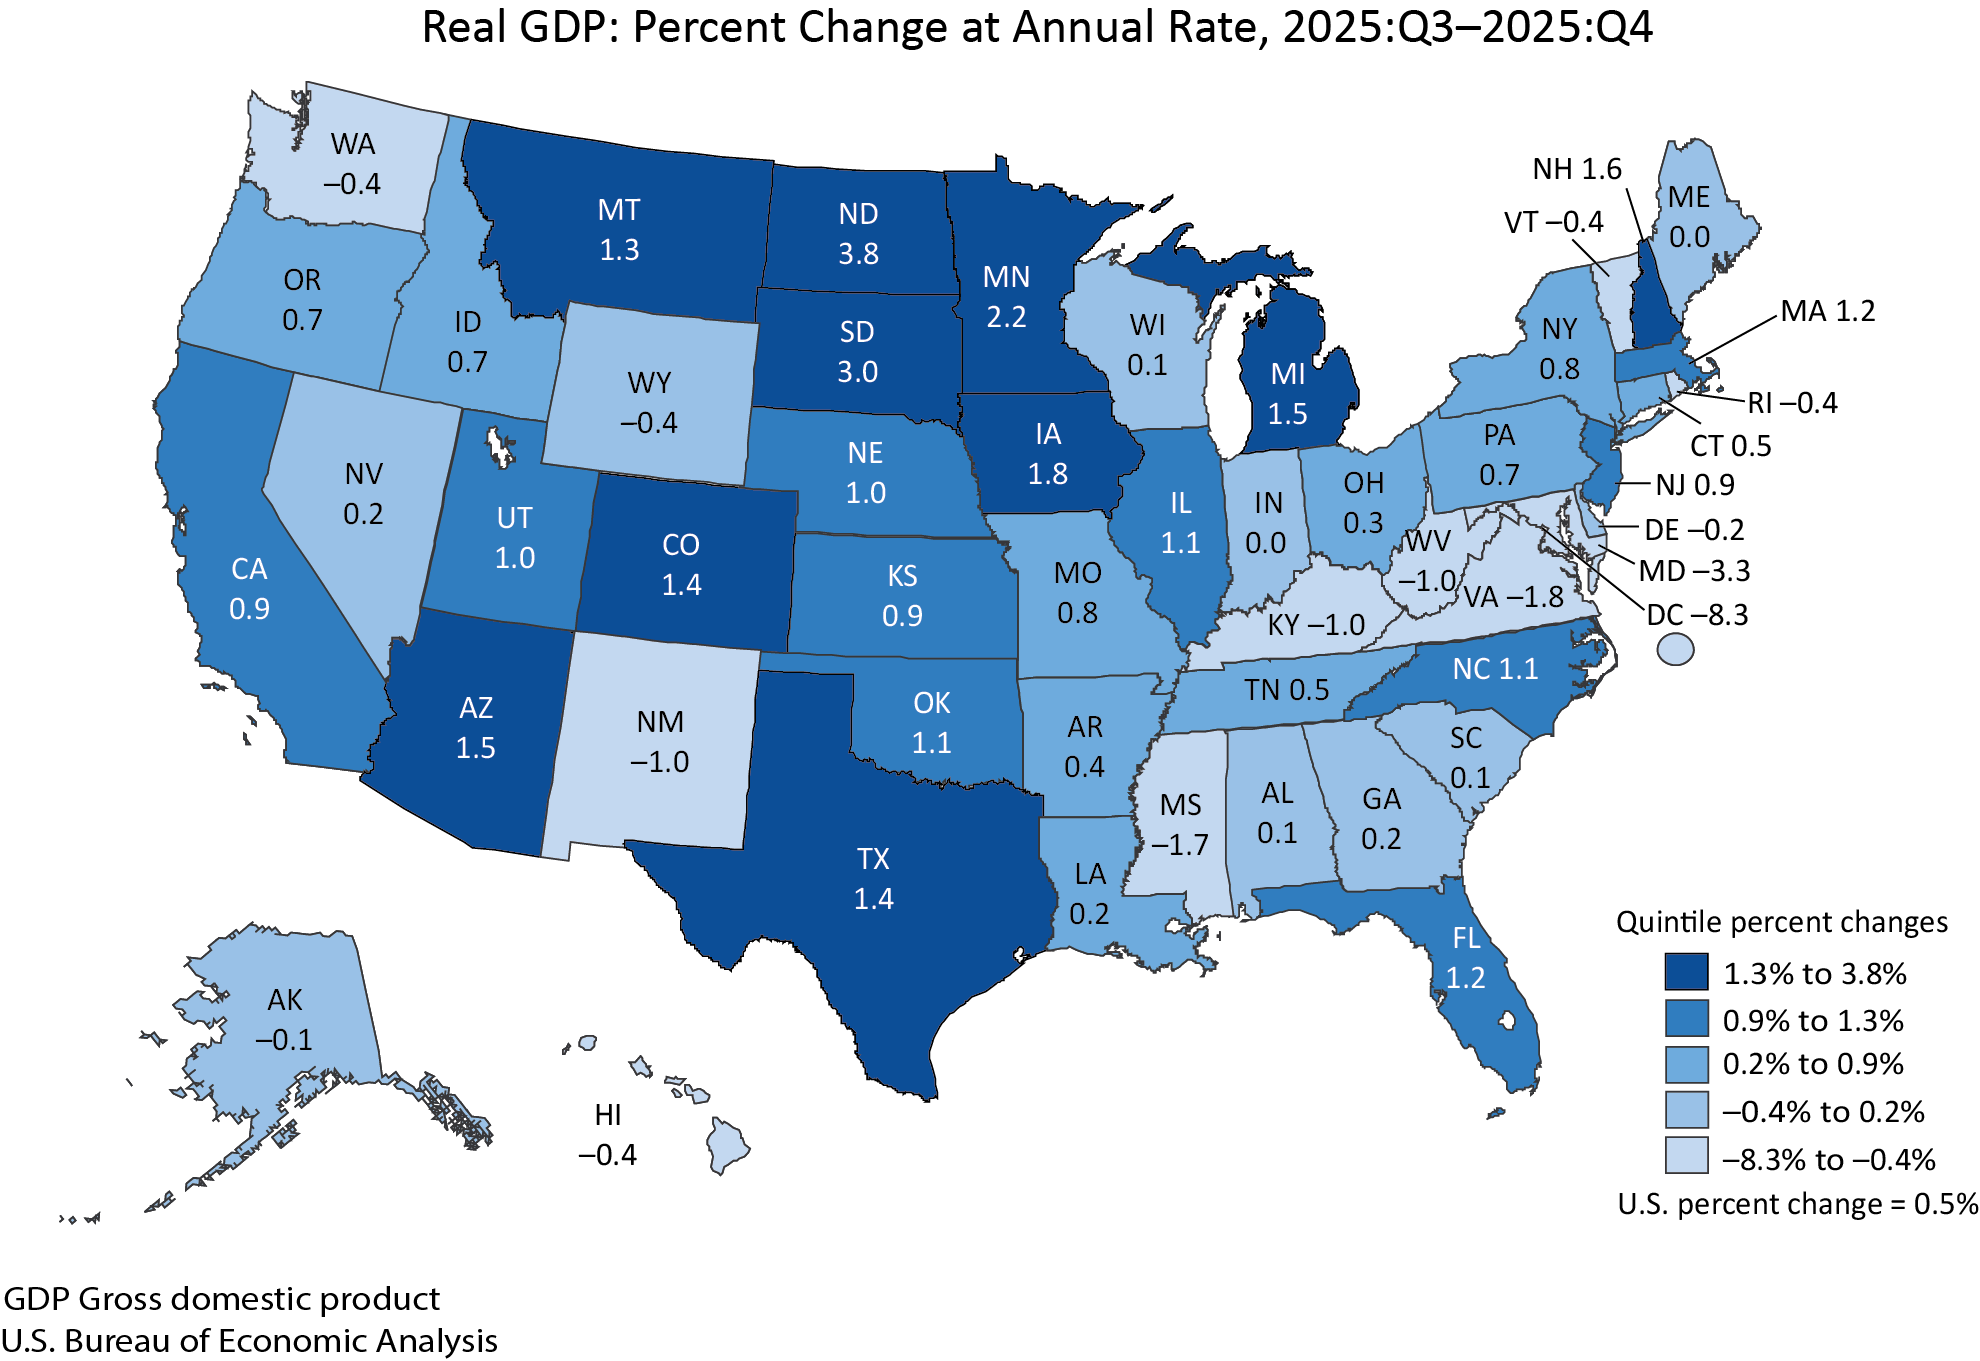
Agriculture, forestry, fishing, and hunting was the leading contributor to the increase in real GDP in North Dakota. Federal civilian was the leading contributor to the decrease in the District of Columbia.
Personal income by state
In the fourth quarter of 2025, current-dollar personal income increased $217.9 billion, or 3.4 percent at an annual rate. Personal income increased in 47 states and the District of Columbia, with the percent change at an annual rate in current-dollar personal income ranging from 41.5 percent in Hawaii to –4.0 percent in North Dakota.
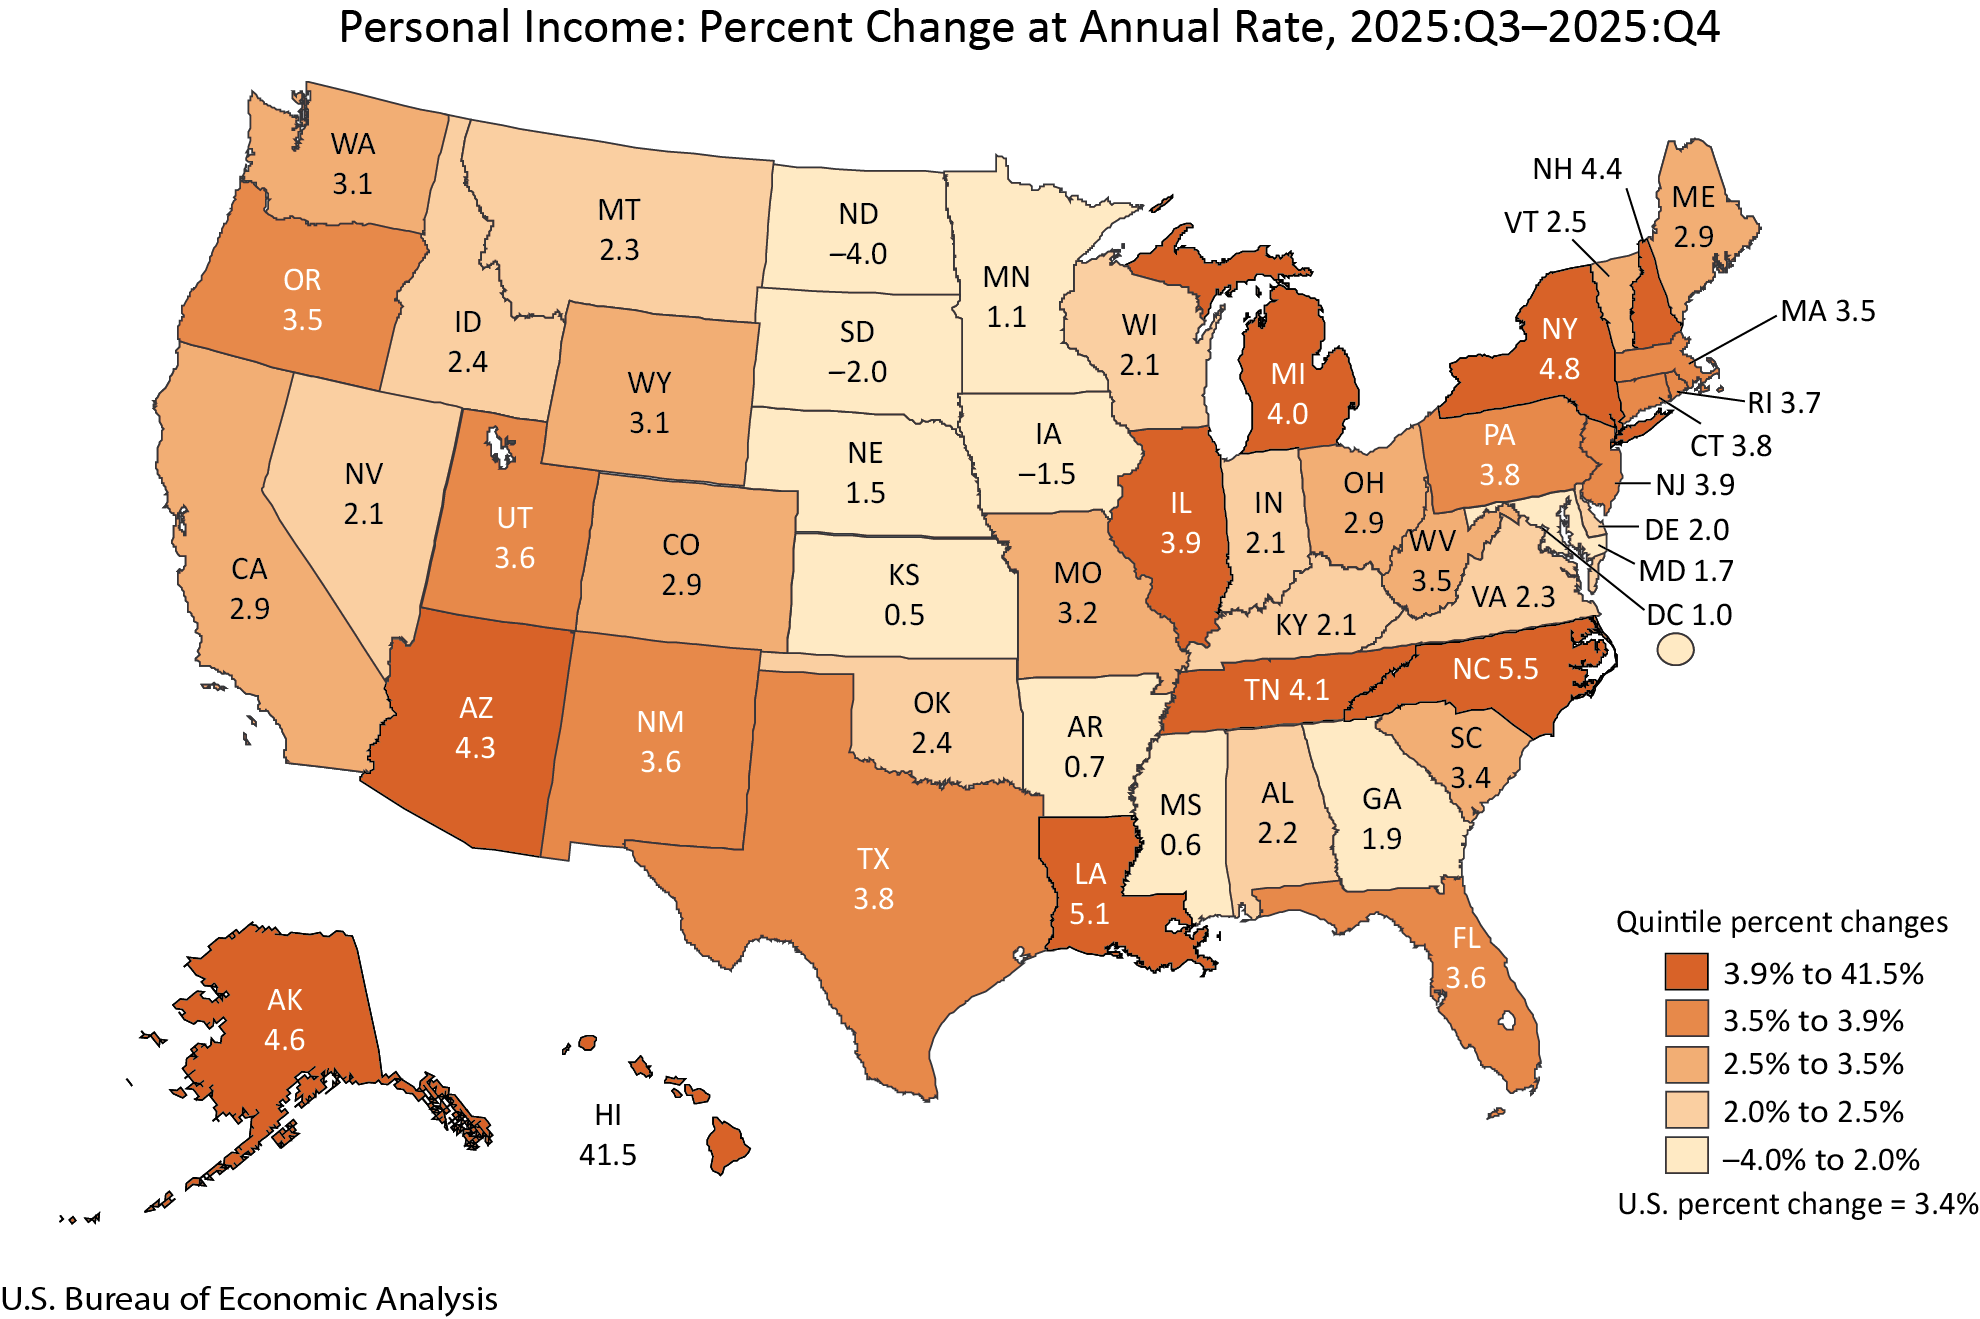
Earnings (compensation plus proprietors’ income) increased in 43 states. The percent change in earnings ranged from 5.9 percent in Massachusetts to –7.1 percent in the North Dakota.
Personal current transfer receipts increased in 42 states and the District of Columbia. The percent change in transfer receipts ranged from 343.4 percent in Hawaii to –4.2 percent in Iowa. The increase in transfer receipts in Hawaii reflected a settlement paid by a domestic electric utility to U.S. households to compensate for claims of personal injury, property damage, and other losses related to the 2023 Maui wildfire.
Property income (dividends, interest, and rent) increased in all 50 states and the District of Columbia. The percent change ranged from 2.6 percent in Wyoming to 0.9 percent in West Virginia.
Annual estimates
Real GDP increased 2.1 percent in 2025 (from the 2024 annual level to the 2025 annual level), the same as previously estimated. The increase in real GDP in 2025 primarily reflected increases in consumer spending and investment.
From an industry perspective in 2025, real value added for private services-producing industries increased 2.7 percent, private goods-producing industries increased 1.2 percent, and government increased less than 0.1 percent. From a regional perspective, real GDP increased in all 50 states and the District of Columbia, with the percent change ranging from 3.1 percent in South Carolina and Florida to 0.3 percent in North Dakota.
The price index for gross domestic purchases increased 2.6 percent in 2025, the same as previously estimated. The PCE price index increased 2.6 percent, and the PCE price index excluding food and energy increased 2.8 percent, both the same as previously estimated.
Real GDI increased 2.4 percent in 2025, compared with an increase of 3.0 percent in 2024. The average of real GDP and real GDI increased 2.3 percent in 2025, compared with an increase of 2.9 percent.
Profits from current production increased $275.7 billion in 2025, compared with an increase of $184.4 billion in 2024.
Current-dollar personal income increased 4.9 percent in 2025 (from the 2024 annual level to the 2025 annual level). From a regional perspective, personal income increased in all 50 states and the District of Columbia, with the percent change ranging from 6.9 percent in Hawaii to 3.2 percent in the District of Columbia.
Improvements to the GDP news release
Today’s GDP release includes improvements that reflect BEA’s ongoing modernization and streamlining of its news releases. The news release text now includes links to BEA’s online interactive data tables to point users directly to the most complete data. To reduce duplication, news release tables in PDF and Excel format are no longer provided.
In addition, GDP and personal income by state data have been accelerated to coincide with the third estimate of U.S. GDP and are now included in the GDP third estimate news release.
Next release: April 30, 2026, at 8:30 a.m. EDT
GDP (Advance Estimate), 1st Quarter 2026
Technical Notes
Sources of revisions to real GDP in the third estimate
Real GDP increased at an annual rate of 0.5 percent (0.1 percent at a quarterly rate1) in the fourth quarter, a downward revision of 0.2 percentage point from the previous estimate, primarily reflecting a downward revision to investment.
- Within investment, the downward revision was led by private inventory investment, particularly wholesale trade, based on updated U.S. Census Bureau inventory data.
More information on the source data and BEA assumptions that underlie the fourth-quarter estimate is shown in the key source data and assumptions table.
Impact of Maui Wildfire on fourth-quarter 2025 estimates
In August 2023, a wildfire burned through the town of Lahaina on the island of Maui, Hawaii. Estimates of corporate profits in the fourth quarter were reduced by a $7.5 billion settlement (annualized rate) for claims of personal injury, property damage, and other losses related to the wildfire. Settlements are recorded in the National Income and Product Accounts (NIPAs) on an accrual basis in the quarter when the settlement is finalized, regardless of when they are recorded on a company’s financial statement. The estimate of GDI was not impacted because these settlements were recorded in the NIPAs as business current transfer payments, which offset the reduction to corporate profits.
October prices
Due to a lapse in federal appropriations, BLS could not collect October 2025 consumer price index (CPI) data. Refer to “2025 federal government shutdown impact on the Consumer Price Index” on the BLS website for more details.
To replace the missing CPIs, BEA derived seasonally adjusted price indexes for October using the geometric mean of the September and November CPIs. BEA derived nonseasonally adjusted price indexes by applying seasonal adjustment factors from October 2024 to the imputed seasonally adjusted values for October 2025.
Note that in “Table 9.1U. Reconciliation of Percent Change in the CPI with Percent Change in the PCE Price Index,” the missing CPI values are indicated with dot leaders.
Federal government shutdown
Due to a lapse in appropriations, some federal government agencies were closed, and some employees were furloughed from October 1 through November 12, 2025. The full effects of the partial federal government shutdown on the fourth-quarter estimates cannot be quantified because they are embedded in the regular source data that underlie the estimates and cannot be separately identified. However, BEA did estimate the effects of a reduction in the labor services supplied by federal employees. BEA estimates that this reduction in services provided by the federal government subtracted about 1.0 percentage point from real GDP growth in the fourth quarter. Because furloughed federal employees received back pay, the shutdown had no impact on current-dollar federal compensation and was reflected as a temporary increase in the prices paid for federal employee compensation. For more information, an FAQ, “How are federal government shutdowns reflected in the methodologies used for estimating GDP?,” is available on BEA’s website.
Related Interactive Data Tables
For the statistics highlighted in this release, as well as historical time series for these statistics, see the below data tables in BEA’s interactive data application.
National GDP and related measures
Table 1.1.1. Percent Change From Preceding Period in Real GDP
Table 1.5.2. Contributions to Percent Change in Real GDP, Expanded Detail
Table 1.4.1. Percent Change From Preceding Period in Real GDP, Real Gross Domestic Purchases, and Real Final Sales to Domestic Purchasers
Table 1.6.7. Percent Change From Preceding Period in Prices for Gross Domestic Purchases
Table 1.7.1. Percent Change From Preceding Period in Real GDP, Real Gross National Product, and Real Net National Product
Table 6.16D. Corporate Profits by Industry
GDP by industry
Percent Changes in Chain-Type Quantity Indexes for Value Added by Industry
Contributions to Percent Change in Real GDP by Industry
Percent Changes in Chain-Type Quantity Indexes for Gross Output by Industry
GDP by state
Table SQGDP1. Quarterly GDP by State—Percent Change at Annual Rates From Preceding Period in Real GDP
Table SQGDP11. Industry Contributions to Percent Change in Real GDP by State
Table SAGDP1. Annual GDP by State—Percent Change From Preceding Period in Real GDP
Personal income by state
Table SQINC1. Quarterly Personal Income by State—Percent Change at Annual Rates From Preceding Period
Table SQINC4. Quarterly Personal Income by State—Percent Change by Major Component
Table SAINC1. Annual Personal Income by State—Percent Change From Preceding Period
Note. With the next releases of these statistics, today’s data will be superseded, and the links above will reflect the latest data. The original data featured in this release can then be accessed in BEA’s Data Archive.