
In recent years, the U.S. equities market has witnessed a dramatic shift in its underlying structure. The performance of broad indices, particularly the Nasdaq-100, has become increasingly concentrated in a handful of innovation-driven giants. Today, 10 of the top constituents — NVIDIA, Apple, Amazon, Alphabet, Microsoft, Meta, Tesla, AMD, Broadcom, and Palantir — collectively account for more than half of the Nasdaq-100’s market capitalization and an even greater share of its year-to-date return. This Magnificent 10 forms a growth and innovation complex that drives the market’s direction, volatility, and investor sentiment.
Despite their outsized impact, investors have lacked a simple, exchange-traded way to access this leadership group as a basket. Broad indices go beyond Magnificent 10 exposure, while single-name derivatives introduce event, liquidity and operational risk. The Cboe Magnificent 10 Index (MGTN) was designed to bridge this gap by bringing these 10 market-leading stocks into one index. The MGTN Index captures the performance, volatility and correlation of the market’s core innovators in one transparent, rules-based, and tradable index.
Cboe’s Mandy Xu, Vice President, Market Intelligence, and Natalie Reed, Senior Director, Derivatives Sales, discuss the Magnificent 10 Index (MGTN) and MGTN options and futures
Market Structure and Concentration Dynamics
Over the past decade, the largest Nasdaq-100 constituents have accelerated their contribution to overall market performance. The combined index weight of the MGTN stocks within the Nasdaq-100 has ranged from 43% to 55% since 2021, underscoring the dominance of a single group of firms whose market capitalization, earnings power and volatility now set the tone for the entire benchmark.
While the broader index has become more diversified in absolute count, its effective exposure has narrowed sharply toward this leadership cohort. The MGTN Index sits at the intersection of broad-market concentration and growth-sector leadership, offering investors a way to isolate, express, or hedge this structural imbalance in a transparent and cash-settled form.
Behavioral Profile of the MGTN Index
The MGTN Index captures the defining behavioral dynamics of today’s U.S. equities landscape, where market leadership, volatility and correlation are dominated by a handful of innovation-driven giants. Five key behavioral dimensions distinguish the MGTN Index from broader benchmarks:
Performance
From 2021 to 2025, the MGTN Index delivered exceptional cumulative returns — rising nearly 300% and surpassing the Nasdaq-100, which was up 120% over the same period. This outperformance reflects the dominant earnings growth and valuation expansion of the stocks that comprise the index.
Cumulative Performance of the MGTN Index Compared to the Nasdaq-100
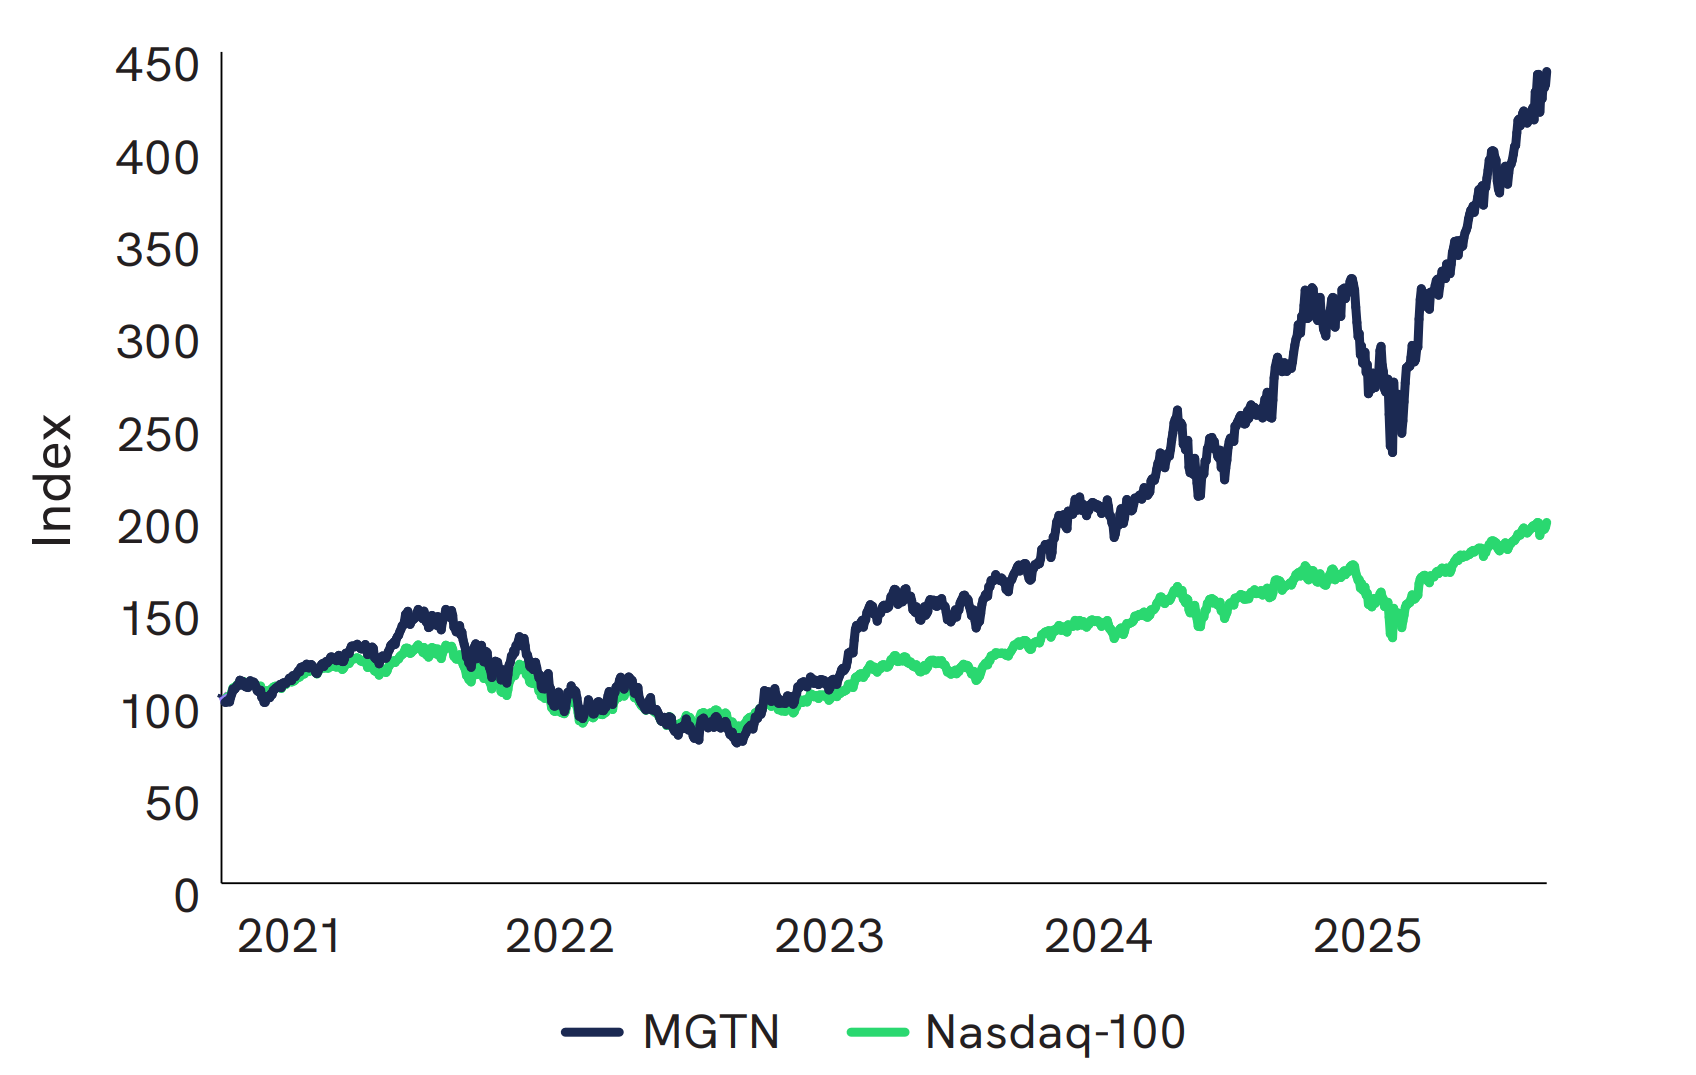
Source: Cboe Data
Beta and Realized Volatility
The MGTN Index consistently exhibits a high-beta, high-volatility profile relative to broader benchmarks. Rolling analysis between 2021 and 2025 showed betas of roughly 1.3-1.5 compared to QQQ, confirming its amplified sensitivity to market moves. Realized volatility fluctuated within a 25%-75% annualized range, occasionally spiking toward 70-80% during periods of market stress.
21-Day Annual Realized Volatility of the MGTN Index Compared to the Nasdaq-100
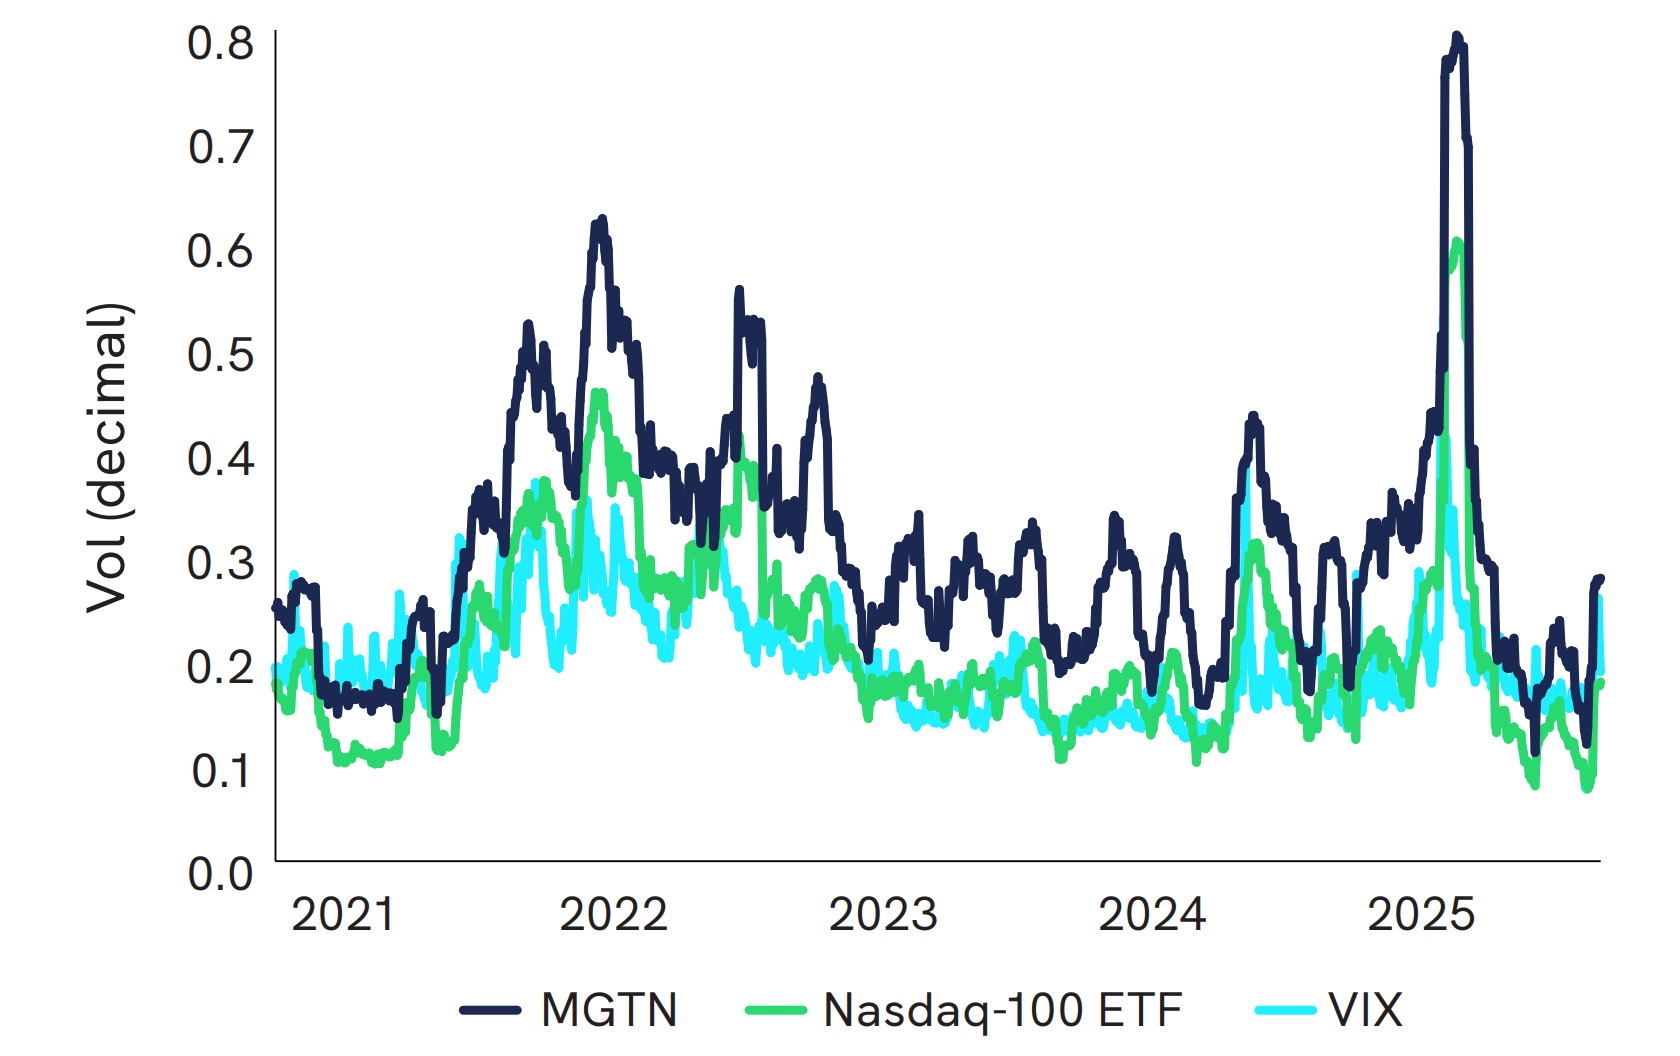
Source: Cboe Data
Drawdown and Recovery
During the 2021-2022 market correction, the MGTN Index fell roughly 49%, compared with a decline of 36% for QQQ. However, the MGTN Index recovered faster, reaching new highs by mid-2023, while QQQ did not fully recover until early 2024. This asymmetry underscores MGTN’s convexity: larger peak-to-trough swings, but quicker rebounds once market sentiment turns positive.
Pairwise Correlation
Correlations among MGTN Index constituents remain structurally high but cyclically variable, typically ranging between 0.35 and 0.75. These dynamics create opportunities for volatility and correlation traders, with rising correlations favoring index variance trades and decaying correlations supporting long dispersion and relative-value strategies.
Average Pairwise Correlation Among MGTN Index and Cboe 1-Month Implied Correlation Index
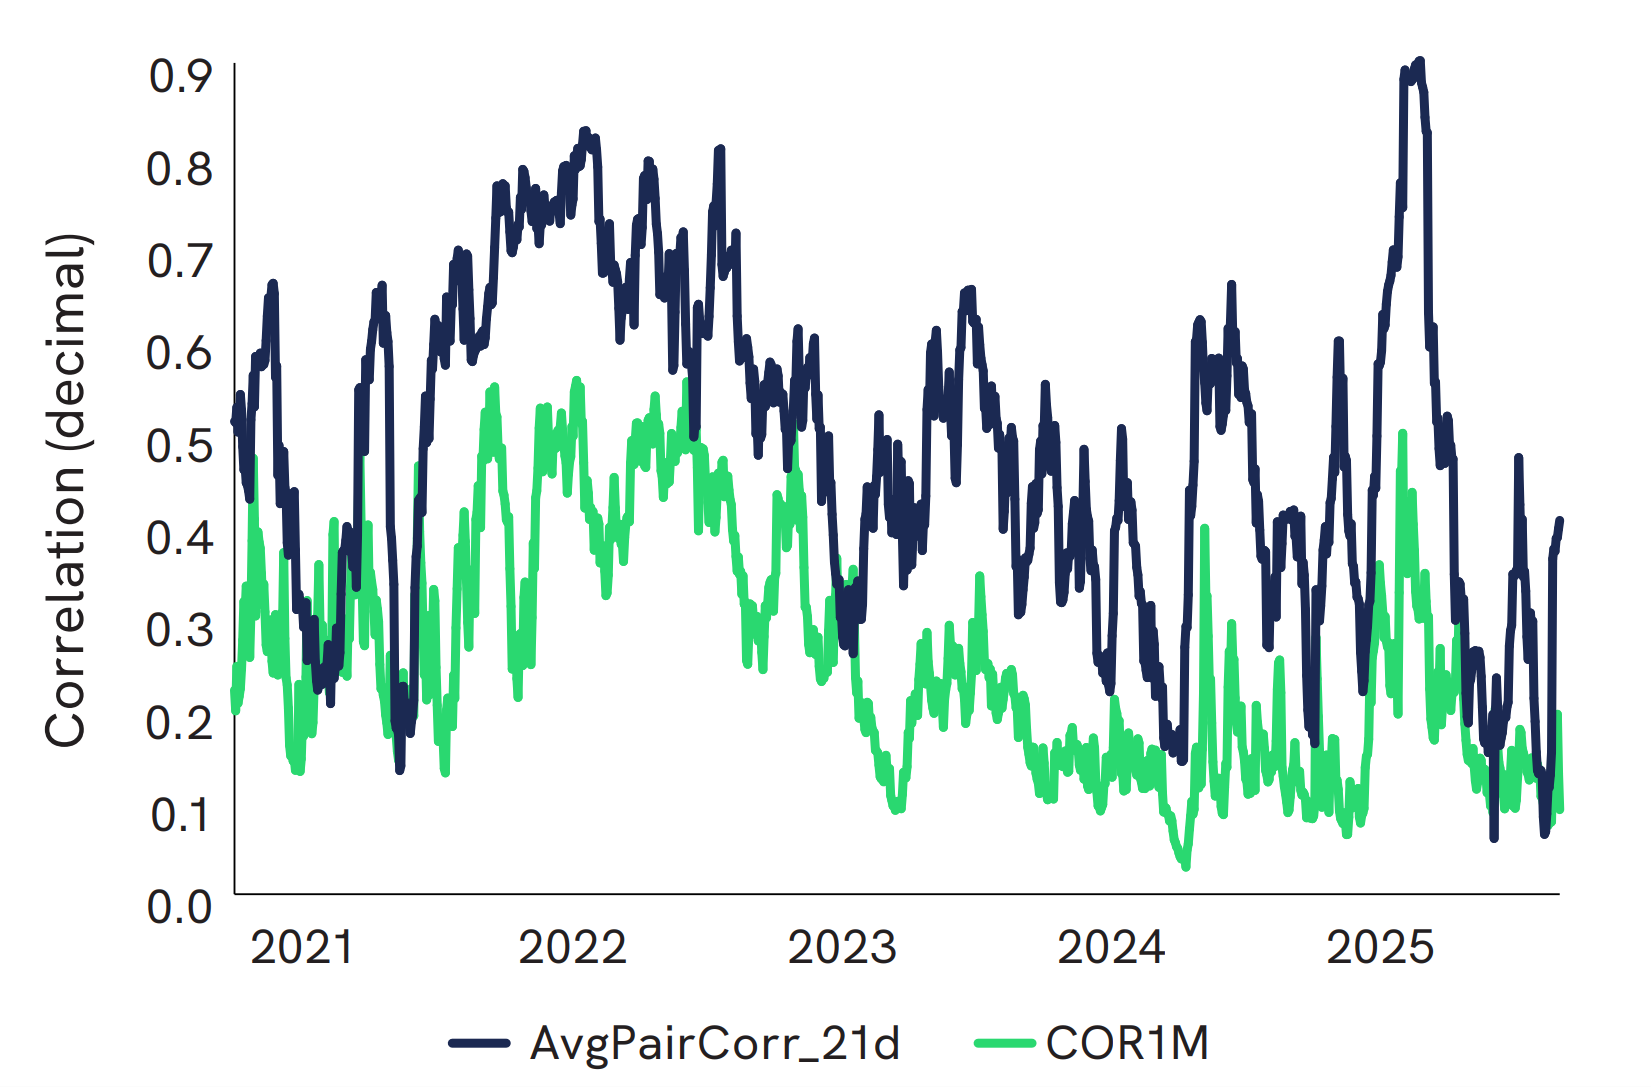
Average Pairwise Correlation uses a 21-day rolling window
Source: Cboe Data
Cross-Sectional Dispersion
Cross-sectional dispersion within the MGTN Index highlights the rotation and idiosyncratic behavior that drive leadership performance. Daily dispersion averaged between 4% and 6%, with outliers above 8% during earnings seasons and sector rotations — nearly double the dispersion observed in broader benchmarks.
Role Within the Equity Derivatives Ecosystem
MGTN Index futures and options sit at the center of Cboe’s index derivatives ecosystem, bridging single-stock risk and broad-index exposure. The MGTN Index transforms an observation about market structure into a new dimension of tradable risk. It distills the leadership of the U.S. equity market into a single, efficient instrument bridging SPX, QQQ, VIX Index, and single-stock options.
Learn more about Cboe Magnificent 10 Index futures or options and download the whitepaper.
The information provided is for general education and information purposes only. No statement provided should be construed as a recommendation to buy or sell a security, future, financial instrument, investment fund, or other investment product (collectively, a “financial product”), or to provide investment advice. Past performance of an index or financial product is not indicative of future results.
There are important risks associated with transacting in any of the Cboe Company products discussed here. Before engaging in any transactions in those products, it is important for market participants to carefully review the disclosures and disclaimers contained at: https://www.cboe.com/global-disclaimers/. In certain jurisdictions, Cboe Company products are only permitted for investment professionals, certified sophisticated investors, or high net worth corporations and associations. These products are complex and are suitable only for sophisticated market participants. These products involve the risk of loss, which can be substantial and, depending on the type of product, can exceed the amount of money deposited in establishing the position. Market participants should put at risk only funds that they can afford to lose without affecting their lifestyle. © 2025 Cboe Exchange, Inc. All rights reserved.