
Nearly two-thirds (64%) of single people struggle to afford their regular rent or mortgage payments, compared with 39% of married people, according to a recent Redfin survey conducted by Ipsos.
These survey results in this report are from a Redfin survey conducted by Ipsos in November 2025, fielded to 4,000 U.S. residents. We consider survey respondents to struggle with housing payments if they selected “I struggle greatly to afford them,” “I regularly struggle, but sometimes okay,” or “I sometimes struggle, but generally okay.” Please see the end of this report for more on methodology.
Many Americans struggle to afford housing because costs have surged over the last few years. Mortgage payments have increased due to a combination of elevated sale prices and mortgage rates that–while down from recent peaks–are still significantly higher than the pre-pandemic and pandemic eras. Renters face similar pressures, with asking rents climbing over the last few years (though rent growth has lost steam recently). Home-sale prices have risen nearly 50% since before the pandemic, while rental prices have risen about 20%. Wages have increased, but not as much as housing costs. Add in rising costs for just about all other day-to-day expenses, and millions of families are left with little cushion.
There are a few key reasons single people typically have a harder time making their housing payments than those who are married:
- Household income is lower for single people. Single people are stuck paying prices much better suited to a double income on a single-income budget; many married couples draw from two incomes, while many single people rely solely on their own income. Nearly half (48%) of single survey respondents report earning a household income of less than $50,000 per year, compared with just 9% of married people. On the flip side, married people are three times more likely than single people to earn household incomes between $100,000 and $500,000 (62% versus 21%).
- Single people face other financial disadvantages. Married couples also receive tax benefits that single people don’t get. And in many cases, married couples split the cost of other expenses like groceries, gas and childcare, so each individual has a smaller financial burden.
- Single people tend to be younger than married people. That means they’re earlier in their careers and haven’t yet hit their earning peak, and they have had less time to build savings. Additionally, many Gen Zers and millennials are still paying off student debt. This Redfin report on homeownership by generation delves deeper into reasons why it is more difficult for young Americans than older Americans to buy homes.
Married couples make up a smaller share of U.S. households than they used to, which Redfin economists say national and local governments should keep in mind when making policies to combat the housing affordability crisis. For instance, officials may consider zoning for ADUs and single-room housing, like dormitories. Policymakers may also consider cutting red tape and making it easier to build apartment complexes and condos full of studios and one-bedrooms.
A Look at the ‘Singles Tax” in D.C. and the Bay Area
Using Washington, D.C. as an example, here’s a breakdown of the extra cost of living alone. We’re using D.C. because more than half of its adult population is single, making it one of the U.S. cities with the biggest proportion of single people.
The typical condo in the D.C. metro area costs $379,000. A buyer’s monthly payment would be $2,974, using current mortgage rates and assuming a $566 HOA fee, the local median. A single person living alone would cover the whole cost themselves, while a married or cohabitating couple may split the cost and pay $1,487 each. Annually, a single person would pay a double-digit “singles tax” of $17,844.
Say you’re single and living alone in San Francisco, one of the most expensive housing markets in the U.S. The typical condo there costs $980,000, with a monthly payment of $6,950 (today’s mortgage rates and a $724 HOA fee, the local median). A single person would pay that alone rather than paying half ($3,475), giving San Francisco a “singles tax” of $41,700.
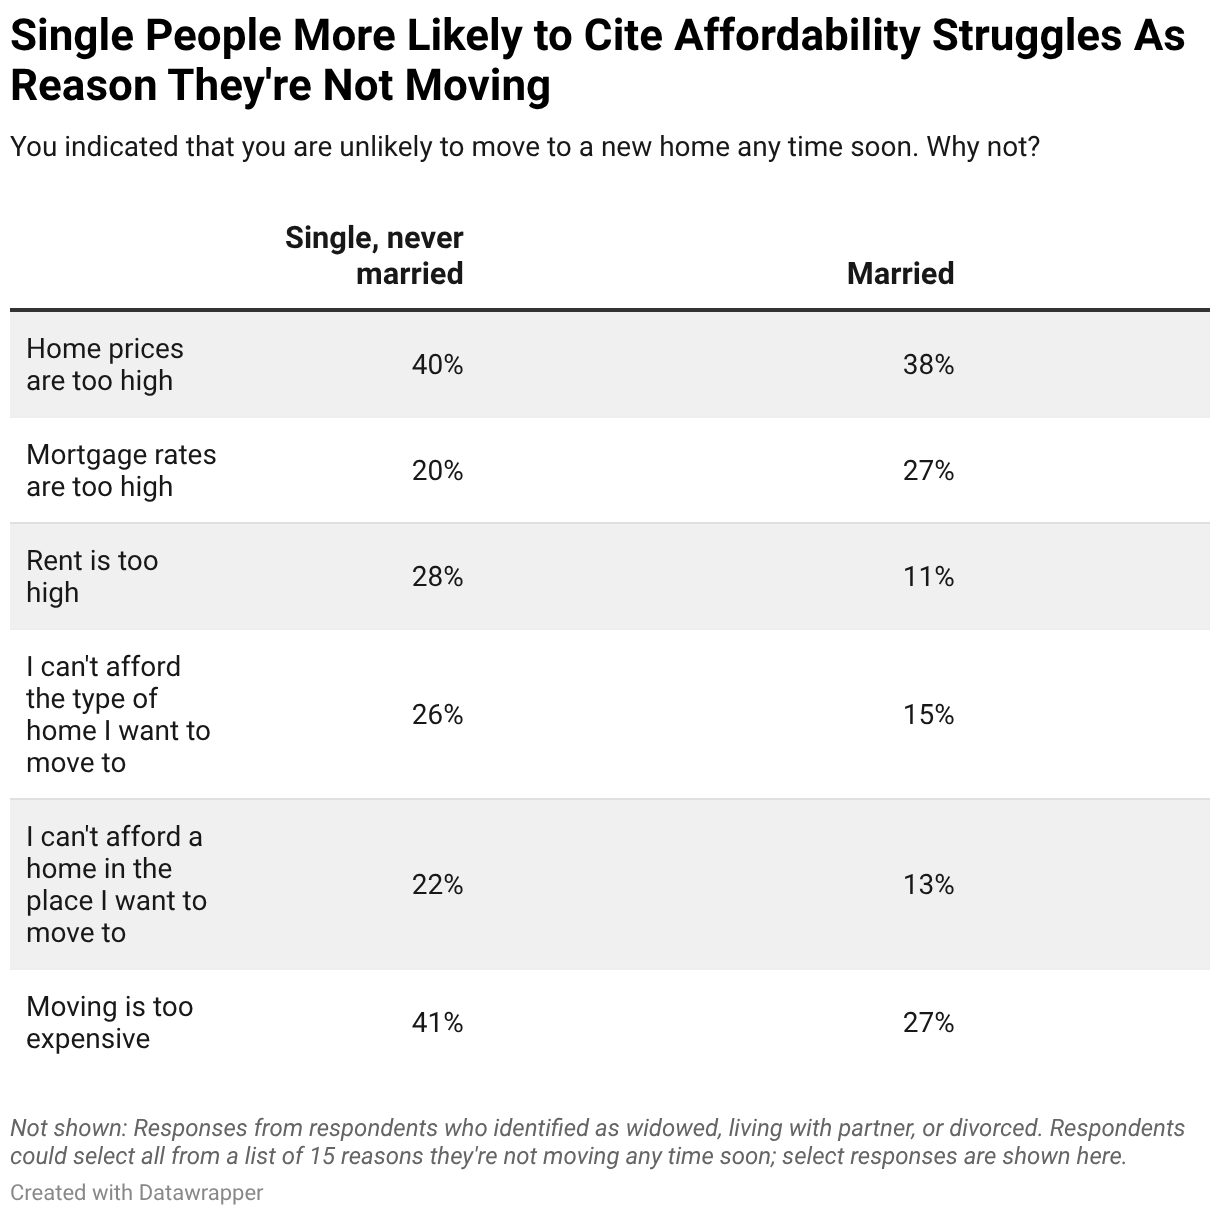
Affordability Concerns Keep Single Americans Stuck in Place
Single Americans are more likely than their married counterparts to cite lack of affordability as a reason they won’t be moving anytime soon.
Single people are nearly twice as likely as married people to say they’re not moving because they can’t afford the type of home they want to move to (26% versus 15%), and more than two in five (41%) single people say they’re not moving because moving is too expensive, compared with 27% of married couples.
| Metro-Level Summary: Median Condo List Price, Dec. 2025
50 most populous U.S. metro areas |
||||
| U.S. metro area | Median list price for condos | Median list price for condos, YoY change | Median monthly mortgage payment for condos, not including HOA dues | Median HOA dues |
| Anaheim, CA | $735,000 | 5.2% | $4,669 | $519 |
| Atlanta, GA | $275,000 | -3.5% | $1,747 | $395 |
| Austin, TX | $387,500 | -3.1% | $2,463 | $365 |
| Baltimore, MD | $285,500 | 2.0% | $1,814 | $422 |
| Boston, MA | $599,000 | -0.2% | $3,805 | $433 |
| Charlotte, NC | $300,000 | 0.1% | $1,933 | $320 |
| Chicago, IL | $275,000 | 5.8% | $1,747 | $392 |
| Cincinnati, OH | $249,503 | 14.7% | $1,581 | $315 |
| Cleveland, OH | $190,000 | 2.8% | $1,207 | $312 |
| Columbus, OH | $274,900 | 1.9% | $1,746 | $303 |
| Dallas, TX | $250,000 | -7.4% | $1,588 | $430 |
| Denver, CO | $320,000 | -3.0% | $2,033 | $449 |
| Detroit, MI | $250,000 | 19.0% | $1,588 | $345 |
| Fort Lauderdale, FL | $234,999 | -4.1% | $1,492 | $678 |
| Houston, TX | $155,000 | -3.1% | $985 | $475 |
| Jacksonville, FL | $259,500 | -3.5% | $1,648 | $521 |
| Las Vegas, NV | $248,694 | -3.2% | $1,577 | $300 |
| Los Angeles, CA | $649,999 | 0.2% | $4,129 | $538 |
| Miami, FL | $465,000 | -0.9% | $2,954 | $985 |
| Milwaukee, WI | $292,450 | 4.8% | $1,873 | $345 |
| Minneapolis, MN | $191,950 | 3.8% | $1,219 | $575 |
| New Brunswick, NJ | $461,250 | 2.7% | $2,938 | $372 |
| Oakland, CA | $505,000 | -7.7% | $3,208 | $608 |
| Orlando, FL | $215,000 | -1.3% | $1,366 | $504 |
| Philadelphia, PA | $307,450 | 2.5% | $1,953 | $543 |
| Phoenix, AZ | $318,750 | 4.5% | $2,027 | $373 |
| Pittsburgh, PA | $270,000 | 8.7% | $1,715 | $345 |
| Portland, OR | $324,900 | 3.1% | $2,064 | $461 |
| Providence, RI | $398,250 | 12.0% | $2,530 | $345 |
| Riverside, CA | $499,000 | 0.0% | $3,170 | $515 |
| Sacramento, CA | $329,900 | -5.7% | $2,096 | $420 |
| St. Louis, MO | $180,000 | -10.0% | $1,144 | $368 |
| San Antonio, TX | $202,500 | -0.7% | $1,286 | $385 |
| San Diego, CA | $615,000 | 2.7% | $3,907 | $480 |
| San Francisco, CA | $980,000 | 3.3% | $6,226 | $724 |
| San Jose, CA | $775,000 | -0.3% | $4,908 | $598 |
| Seattle, WA | $475,000 | -7.8% | $3,018 | $542 |
| Tampa, FL | $250,000 | 12.6% | $1,588 | $706 |
| Warren, MI | $255,000 | 6.3% | $1,620 | $315 |
| Washington, DC | $379,000 | -1.5% | $2,408 | $566 |
| West Palm Beach, FL | $278,000 | -2.5% | $1,747 | $736 |
Methodology
The survey results in this report are from a Redfin survey conducted by Ipsos in November 2025. The survey was fielded to 4,000 U.S. residents, 1,007of whom indicated they were single, and 2,005 of whom indicated they were married. The results for the total group of survey respondents have a credibility interval of +/-1.9 percentage points.
Section one of this report focuses on respondents who said they struggle to afford housing. We asked, “To what extent, if any, do you struggle to afford your regular rent or mortgage payment?” We consider survey respondents to struggle with housing payments if they selected “I struggle greatly to afford them,” “I regularly struggle, but sometimes okay,” or “I sometimes struggle, but generally okay.”
We also report on the survey question, “You indicated that you are unlikely to move to a new home any time soon. Why not?” That question was asked of the 3,132 respondents who indicated they were unlikely to move soon, including 722 single people and 1,660 married people.
Here’s the full survey questionnaire for questions referenced in this report.