
- Home sellers outnumbered buyers by a record 36.8% in October, giving buyers who were in the market room to negotiate.
- The number of buyers in the market dropped 1.7% to the lowest level on record aside from the start of the pandemic amid high housing costs and economic uncertainty.
- The number of sellers dropped 0.5% to the lowest level since February as sellers retreated in response to low buyer demand.
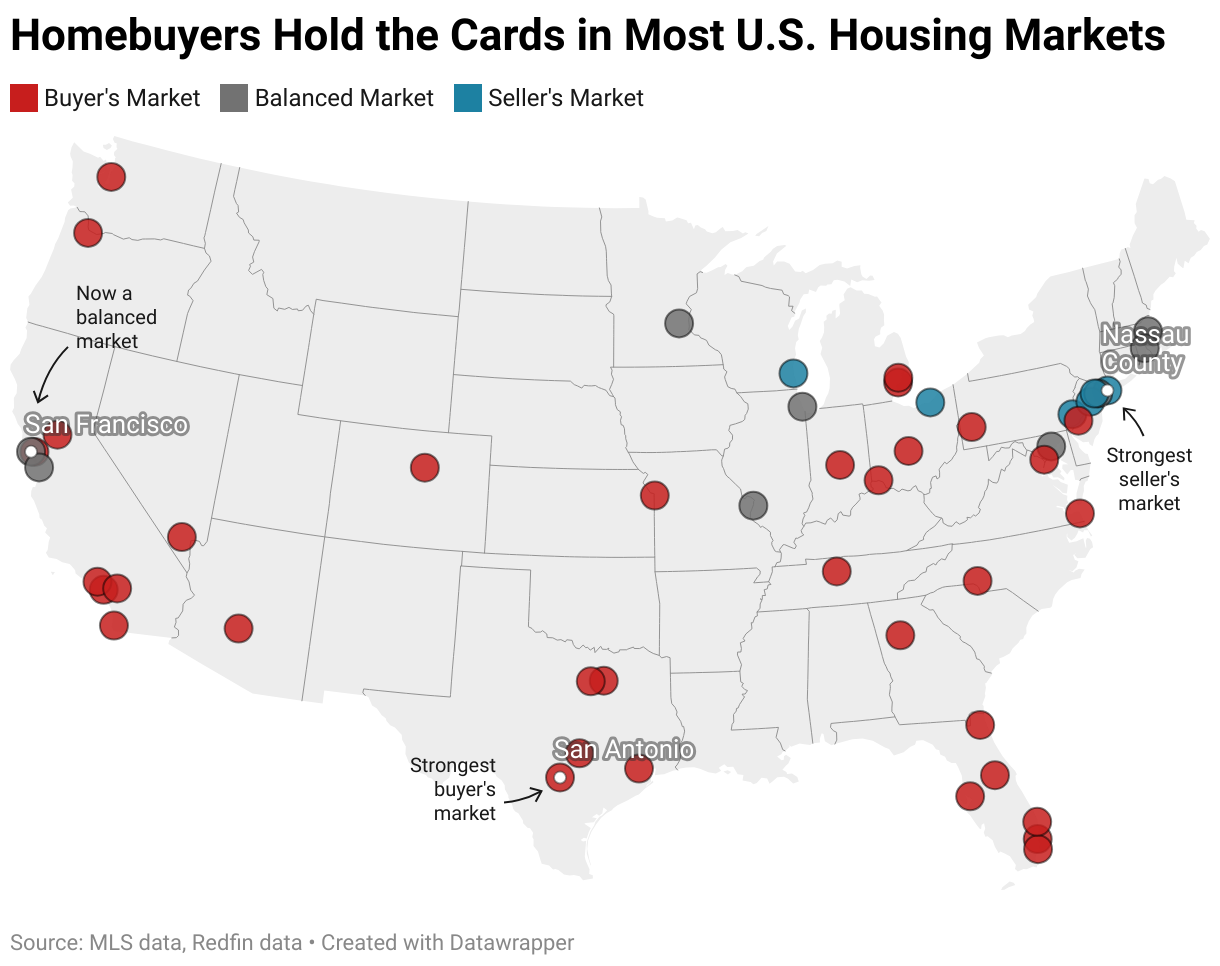
- The strongest buyer’s markets are in Texas and Florida, while the strongest seller’s markets are in the Tri-State area. San Francisco quickly shifted to a balanced market.
There were an estimated 36.8% more home sellers than buyers in the U.S. housing market in October (or 528,769 more, in numerical terms)—the largest gap in records dating back to 2013.
We define a market where there are over 10% more sellers than buyers as a buyer’s market and a market where there are over 10% fewer sellers than buyers as a seller’s market. A market where the gap is plus or minus 10% is considered a balanced market. By this definition, it has been a buyer’s market since May 2024. There have been over 30% more sellers than buyers since April 2025. Redfin economists estimate that the last time we saw a stronger buyer’s market was in the years following the 2008 financial crisis.
When sellers outnumber buyers, buyers typically hold the negotiating power because they have a lot of options to choose from. That’s why a market with a lot more sellers than buyers is considered a buyer’s market. Of course, it’s only a buyer’s market for those who can afford to buy—many Americans have been priced out of the housing market as affordability has eroded.

We estimated the number of buyers using proprietary Redfin data on the typical time from a buyer’s first tour to close of purchase, and MLS data on active listings and pending sales. The estimated number of sellers in the market is simply the number of active listings in the MLS. These estimates, along with median-sale price data in this report, are seasonally adjusted and subject to revision. See a more detailed methodology here and view an interactive dashboard here.
“There’s a shortage of both first-time buyers and repeat buyers because mortgage rates and home prices have gone up so much in recent years,” said Matt Purdy, a Redfin Premier real estate agent in the Denver area. “At the same time, there are homeowners who need to sell because they have to relocate for a job or are getting divorced. Sellers want top dollar because they’re focused on recouping their investment, but buyers are focused on having a low monthly payment, so there’s this gap in expectations that’s making it hard for buyers and sellers to see eye to eye. Oftentimes the buyer ends up winning the negotiation because they have options—there are a lot of sellers who are desperate to make a deal happen.”
Number of Homebuyers Hits Second Lowest Level on Record
The number of homebuyers in the U.S. housing market dropped 1.7% month over month in October to an estimated 1.44 million—the lowest level on record aside from April 2020, when the coronavirus pandemic brought the housing market to a halt. That’s the largest monthly decline since June.
Sellers have also been retreating, but not as quickly. The number of sellers in the market fell 0.5% month over month to an estimated 1.97 million—the lowest level since February. That marks the fifth-straight monthly decline in the number of sellers.
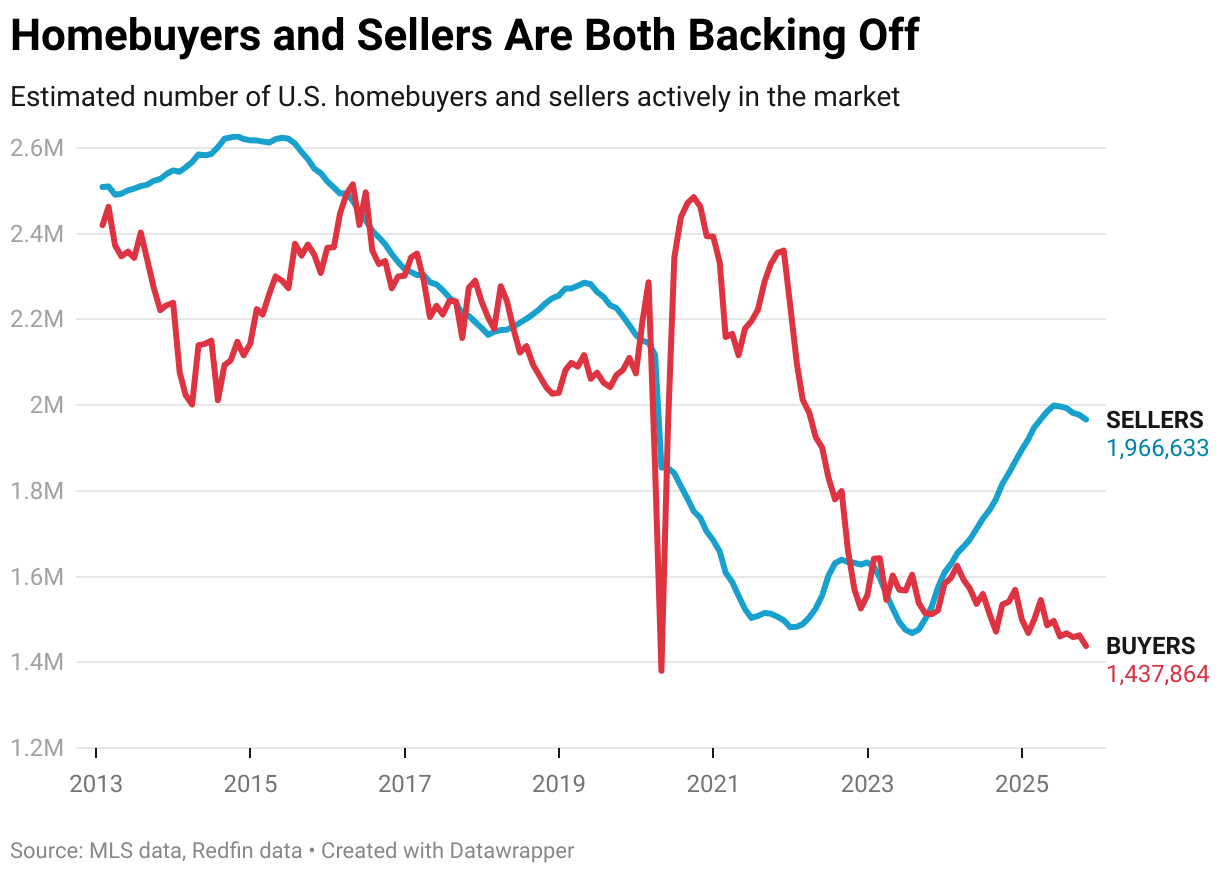
Buyers are backing off due to high housing costs and economic uncertainty. Sellers, many of whom are buyers themselves, are backing off in response to lackluster demand for their homes. Redfin agents report that some sellers are delisting after watching their homes sit on the market for months with zero bites from buyers, while others are opting not to list at all after seeing their neighbor’s house sell for under the asking price.
The Strongest Buyer’s Markets Are in Texas and Florida, While the Strongest Seller’s Markets Are in the Tri-State Area
In San Antonio, there were an estimated 18,467 home sellers and 8,497 homebuyers in October. That means there were 117% more sellers than buyers—the largest imbalance among the 50 most populous U.S. metropolitan areas. Next came Austin, TX (115%), Miami (108%), Fort Lauderdale, FL (107%) and Nashville (105%).
The Sun Belt skyrocketed in popularity during the pandemic, when scores of homebuyers moved in from more expensive parts of the country, driving up housing costs and pricing many locals out of the market. To meet surging demand, homebuilders ramped up activity, which is one reason there are now a lot more homes for sale than people who want to buy them.
Texas and Florida continue to build more homes than other states. Florida is also grappling with intensifying natural disasters, soaring insurance premiums and rising condo HOA fees, which has prompted some homeowners to leave.
Overall, 35 of the 50 most populous metros were buyer’s markets, nine were balanced markets and six were seller’s markets. The buyer’s markets are concentrated in the Sun Belt and on the West Coast, while balanced markets and seller’s markets skew more toward the Midwest and East Coast.
Nassau County, NY was the strongest seller’s market in October, with an estimated 7,442 sellers and 11,888 buyers—or 37.4% fewer sellers than buyers. The other five seller’s markets are Newark, NJ (34.9%), Montgomery County, PA (34%), New Brunswick, NJ (25.2%), Milwaukee (15.1%) and Cleveland (14.4%).
New construction can have a significant influence on whether negotiating power lies with buyers or sellers because it impacts the balance of supply and demand. The Northeast and the Midwest issue the fewest building permits, while the South and the West issue the most.
Home prices rose an average of 7.1% year over year across the six seller’s markets in October, compared with a 3% gain across balanced markets and a 1.5% increase across buyer’s markets—an indication that buyers in buyer’s markets have more leverage.
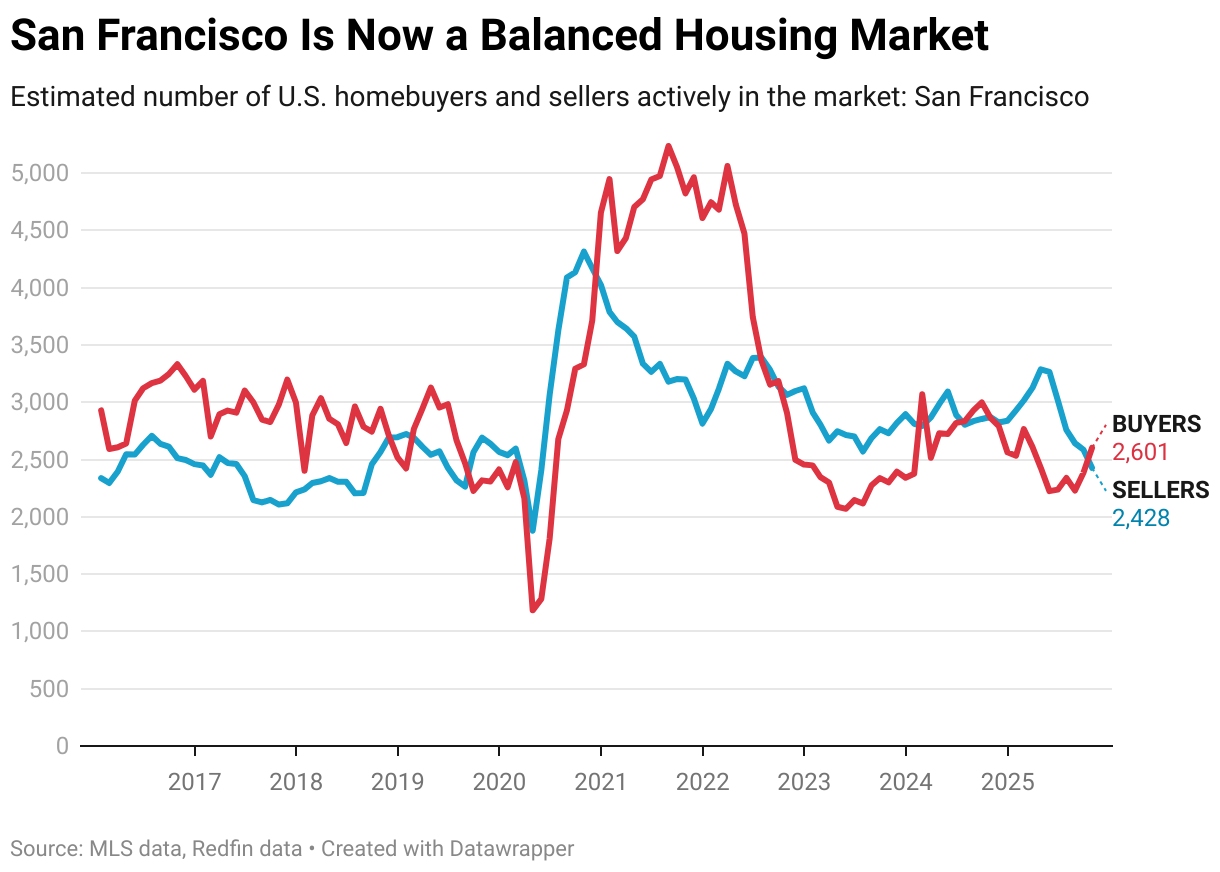
San Francisco Is Now a Balanced Market After Months in Buyer’s Market Territory
One interesting trend we noticed is that San Francisco has shifted from a buyer’s market to a balanced market, with roughly the same amount of estimated buyers (2,601) as sellers (2,428). It has now been a balanced market for two months after being a buyer’s market for six months in a row.
San Francisco had an estimated 6.6% fewer sellers than buyers in October—a small enough gap to put it in balanced-market territory. By comparison, it had an estimated 46.8% more buyers than sellers as recently as May.
Read more about what’s driving the Bay Area housing market here.
Metro-Level Summary: 50 Most Populous Metros (October 2025)
| U.S. metro area | Balance of power | Percent by which sellers outnumber buyers | Sellers | Buyers | Median sale price | Median sale price: Y/Y change |
|---|---|---|---|---|---|---|
| Anaheim, CA | Buyer’s Market | 17.7% | 7,086 | 6,018 | $1,216,914 | 3.8% |
| Atlanta, GA | Buyer’s Market | 59.2% | 35,044 | 22,017 | $388,998 | -2.5% |
| Austin, TX | Buyer’s Market | 114.7% | 17,176 | 7,999 | $449,647 | 2.1% |
| Baltimore, MD | Balanced Market | 2.8% | 10,354 | 10,075 | $406,370 | 3.8% |
| Boston, MA | Balanced Market | -6.5% | 10,819 | 11,571 | $751,533 | 3.5% |
| Charlotte, NC | Buyer’s Market | 70.4% | 16,574 | 9,725 | $417,990 | 3.7% |
| Chicago, IL | Balanced Market | -2.7% | 25,680 | 26,393 | $375,118 | 7.6% |
| Cincinnati, OH | Buyer’s Market | 33.2% | 8,288 | 6,223 | $307,901 | 6.1% |
| Cleveland, OH | Seller’s Market | -14.4% | 7,018 | 8,200 | $249,055 | 11.6% |
| Columbus, OH | Buyer’s Market | 34.2% | 8,812 | 6,568 | $351,721 | 2.7% |
| Dallas, TX | Buyer’s Market | 98.3% | 31,594 | 15,930 | $407,712 | -3.6% |
| Denver, CO | Buyer’s Market | 52.8% | 15,501 | 10,143 | $584,200 | -2.0% |
| Detroit, MI | Buyer’s Market | 46.0% | 7,203 | 4,934 | $208,518 | 10.4% |
| Fort Lauderdale, FL | Buyer’s Market | 107.3% | 19,730 | 9,516 | $456,658 | -1.2% |
| Fort Worth, TX | Buyer’s Market | 77.3% | 13,192 | 7,442 | $356,920 | -1.4% |
| Houston, TX | Buyer’s Market | 43.1% | 44,200 | 30,895 | $335,902 | -1.0% |
| Indianapolis, IN | Buyer’s Market | 25.9% | 9,235 | 7,337 | $314,462 | 4.1% |
| Jacksonville, FL | Buyer’s Market | 90.7% | 13,160 | 6,901 | $362,851 | -4.0% |
| Kansas City, MO | Buyer’s Market | 18.7% | 8,954 | 7,546 | $350,947 | 7.5% |
| Las Vegas, NV | Buyer’s Market | 87.4% | 13,636 | 7,277 | $441,808 | -0.2% |
| Los Angeles, CA | Buyer’s Market | 41.8% | 21,506 | 15,170 | $908,079 | 0.6% |
| Miami, FL | Buyer’s Market | 108.0% | 20,422 | 9,817 | $561,407 | 0.1% |
| Milwaukee, WI | Seller’s Market | -15.1% | 4,705 | 5,544 | $357,716 | 9.1% |
| Minneapolis, MN | Balanced Market | -3.2% | 13,216 | 13,658 | $392,487 | 1.6% |
| Montgomery County, PA | Seller’s Market | -34.0% | 5,116 | 7,751 | $495,357 | 3.2% |
| Nashville, TN | Buyer’s Market | 104.7% | 15,408 | 7,525 | $488,432 | 5.9% |
| Nassau County, NY | Seller’s Market | -37.4% | 7,442 | 11,888 | $739,325 | 5.6% |
| New Brunswick, NJ | Seller’s Market | -25.2% | 8,697 | 11,629 | $563,218 | 2.3% |
| New York, NY | Balanced Market | -5.1% | 29,003 | 30,552 | $775,479 | 3.2% |
| Newark, NJ | Seller’s Market | -34.9% | 5,818 | 8,938 | $621,511 | 10.7% |
| Oakland, CA | Buyer’s Market | 22.3% | 5,898 | 4,821 | $927,476 | -0.6% |
| Orlando, FL | Buyer’s Market | 58.4% | 18,243 | 11,519 | $410,053 | 0.0% |
| Philadelphia, PA | Buyer’s Market | 15.2% | 8,155 | 7,078 | $299,392 | 5.2% |
| Phoenix, AZ | Buyer’s Market | 58.7% | 31,159 | 19,628 | $462,228 | 0.5% |
| Pittsburgh, PA | Buyer’s Market | 40.8% | 9,509 | 6,752 | $248,367 | 4.7% |
| Portland, OR | Buyer’s Market | 48.9% | 10,820 | 7,269 | $547,236 | -1.4% |
| Providence, RI | Balanced Market | -9.8% | 4,237 | 4,698 | $519,673 | 6.1% |
| Riverside, CA | Buyer’s Market | 50.9% | 18,877 | 12,510 | $583,007 | -1.7% |
| Sacramento, CA | Buyer’s Market | 30.6% | 7,295 | 5,585 | $594,025 | 1.2% |
| San Antonio, TX | Buyer’s Market | 117.3% | 18,467 | 8,497 | $303,896 | -0.6% |
| San Diego, CA | Buyer’s Market | 18.5% | 7,805 | 6,585 | $898,457 | -1.2% |
| San Francisco, CA | Balanced Market | -6.6% | 2,428 | 2,601 | $1,524,280 | -1.6% |
| San Jose, CA | Balanced Market | 1.6% | 2,564 | 2,525 | $1,597,483 | -2.1% |
| Seattle, WA | Buyer’s Market | 19.5% | 9,448 | 7,908 | $844,331 | -0.1% |
| St. Louis, MO | Balanced Market | 8.1% | 9,788 | 9,054 | $287,422 | 4.9% |
| Tampa, FL | Buyer’s Market | 92.0% | 25,223 | 13,139 | $371,819 | -1.3% |
| Virginia Beach, VA | Buyer’s Market | 17.3% | 7,694 | 6,557 | $366,885 | 3.9% |
| Warren, MI | Buyer’s Market | 20.3% | 8,752 | 7,276 | $319,850 | 2.6% |
| Washington, DC | Buyer’s Market | 19.6% | 17,862 | 14,933 | $593,712 | 4.8% |
| West Palm Beach, FL | Buyer’s Market | 101.3% | 16,831 | 8,359 | $517,415 | 3.9% |
| United States of America | Buyer’s Market | 36.8% | 1,966,633 | 1,437,864 | $437,215 | 1.0% |