
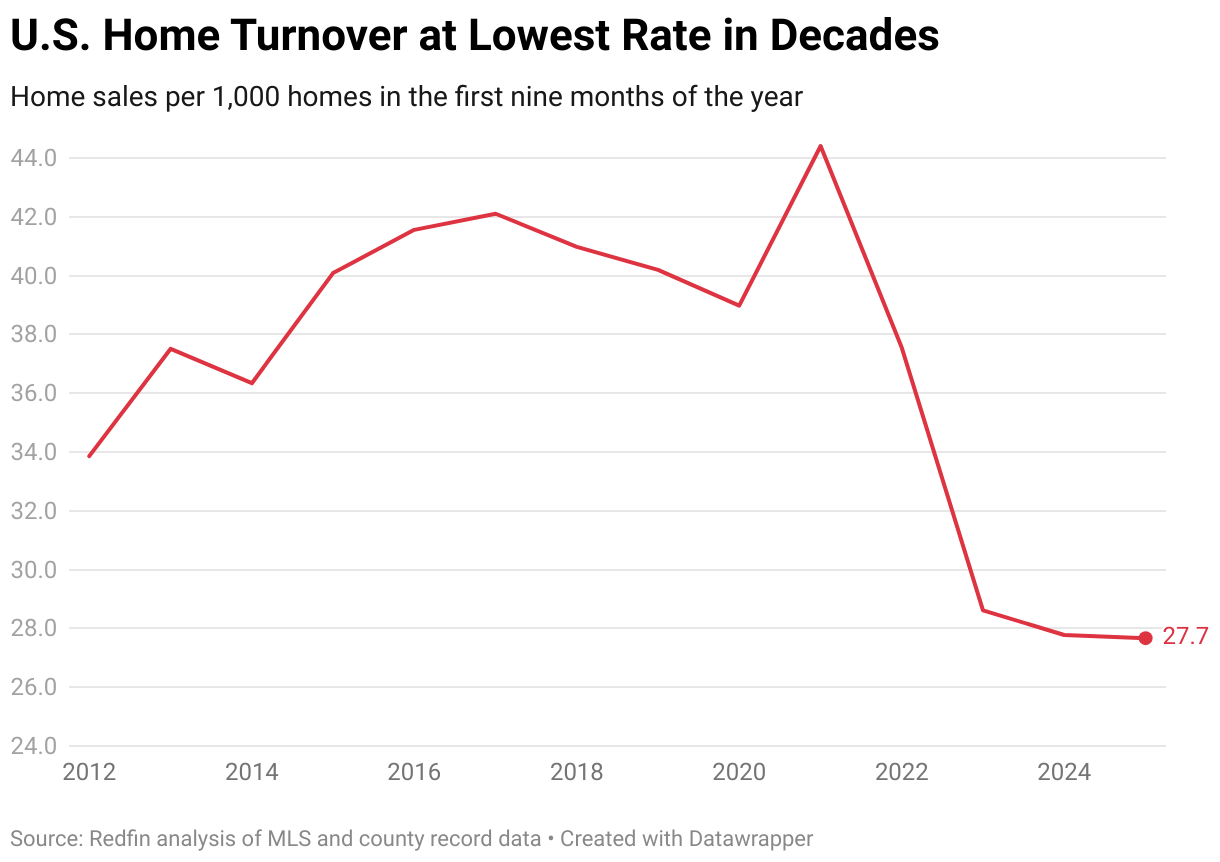
- Just 28 out of every 1,000 U.S. homes changed hands in the first nine months of 2025, the lowest rate since the 1990s.
- Affordability challenges and uncertainty about the economy are keeping buyers and sellers on the sidelines.
- Homes turned over the most in Virginia Beach, VA and West Palm Beach, FL, while turning over the least in New York and Los Angeles.
Only 28 out of every 1,000 (2.8%) U.S. homes have changed hands in 2025—the lowest turnover rate in at least 30 years.
That’s according to a Redfin analysis of home turnover rates, based on MLS data and county records. The turnover rate is defined as the number of homes that are sold in the first nine months of the year, divided by the total number of sellable homes that exist.
Our analysis examined the period between 2012-2025, but we can confidently say this year’s 2.8% turnover rate is the lowest since at least the early-mid 1990s. Existing home sales back then were similar to this year, but the number of homes that existed was smaller—meaning the turnover rate was higher.
38% fewer homes sold this year than during the pandemic peak
This year’s turnover rate (2.77%) was down ever so slightly from 2.78% last year, when existing home sales fell to the lowest level since 1995.
There were 37.7% fewer homes sold this year than during the middle of the pandemic buying frenzy in 2021 (44 of every 1,000) and 31.2% fewer homes sold than during the last pre-pandemic year in 2019 (40 of every 1,000).
Homes are turning over at historically low rates because:
- Affordability challenges have kept many buyers on the sidelines. Home prices are near record highs and borrowing costs remain elevated, causing the number of sellers to far outweigh the number of buyers.
- Sellers are unwilling to give up their low mortgage rates. More than 70% of mortgaged U.S. homeowners have a rate below 5%, well below the current rate of 6.17%. While the share of mortgages above 6% is at a 10-year high, many homeowners are still rate-locked and unwilling to sell.
- Economic uncertainty has made buyers cautious. Concerns about job security, inflation, and broader instability caused many would-be movers to delay major purchases, further slowing the pace of transactions.
“America’s housing market is defined right now by caution,” said Chen Zhao, Redfin’s head of economics research. “Buyers are walking away from deals more often, sometimes due to affordability issues and sometimes because they’re re-evaluating whether now is the right moment to commit. Others aren’t even shopping, waiting instead for prices or mortgage rates to come down. On the other side, many sellers are staying put—either because they’re locked into low rates or unwilling to accept offers below expectations. When both sides hesitate, sales naturally fall to historic lows.”
More homes are being listed in 2025 than the past two years
The rate of homes being listed for sale in the first nine months of the year rose a little to 3.9%—meaning 39 out of every 1,000 homes were listed for sale. It was the third-slowest rate of homes being listed in records going back to 2012, just a fraction higher than last year’s 3.7% and 2023’s record low of 3.5%.
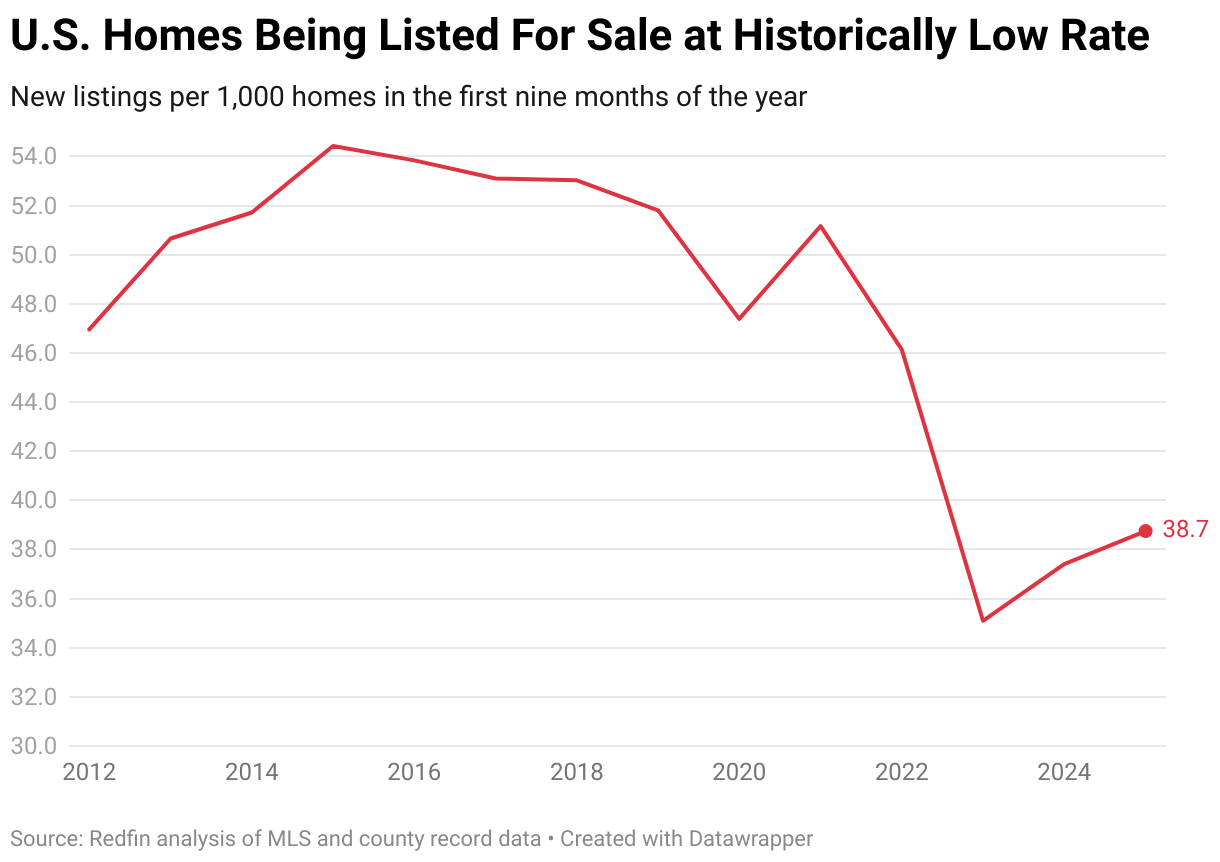
This year’s rate is down 25.2% from before the pandemic in 2019 (52 listings per 1,000 homes) and 24.3% down from 2021 (51 listings per 1,000 homes).
Sales of condos/townhouses down more than 3% from a year ago
Around 30 out of every 1,000 single family homes sold in the first nine months of this year, a slightly faster clip than the roughly 22 out of every 1,000 condos/townhouses that sold.
| Home Sales Per 1,000 Homes (Jan-Sep 2025) | ||
| Sales Turnover Rate | New Listings Rate | |
| Single Family Homes | 29.9 (+0.6% YoY) | 41.1 (4.1% YoY) |
| Condos/Townhouses | 22.2 (-3.3% YoY) | 33.1 (2.3% YoY) |
The sales turnover rate for condos/townhouses fell 3.3% year over year, while the rate for single family homes ticked up 0.6%.
That’s in line with Redfin data showing how hard it is to sell condos this year, with an estimated 72.3% more condo sellers than buyers nationwide in August.
Around 33 out of every 1,000 condos/townhouses listed for sale in the first nine months of the year, while around 41 out of every 1,000 single family homes were listed for sale.
Homes turning over the most in Virginia Beach and West Palm Beach
Virginia Beach, VA topped the list of 50 most populous U.S. metros with the highest turnover rate, with around 35 out of every 1,000 homes sold in the first nine months of the year.
| Major U.S. Metros With Highest Turnover Rates (Jan-Sep 2025) | |||
| Rank | Metro | Sales per 1,000 Homes | YoY Change |
| 1 | Virginia Beach, VA | 35.2 | +5.3% |
| 2 | West Palm Beach, FL | 32.6 | -8.8% |
| 3 | Tampa, FL | 31.2 | -13.7% |
| 4 | Indianapolis | 30.3 | +1.4% |
| 5 | Atlanta | 30.1 | -4.6% |
The next metros with the highest turnover rate this year were West Palm Beach, FL (32.6 sales per 1,000 homes), Tampa, FL (31.2 sales per 1,000 homes), Indianapolis (30.3 sales per 1,000 homes) and Atlanta (30.1 sales per 1,000 homes).
Demand in the Sun Belt has softened significantly since the peak of the pandemic and the sales rate is continuing to drop fast in many of the region’s metro areas.
San Antonio’s turnover rate fell to 24 sales per 1,000 homes, down -26.9% from a year ago and the biggest decline among the top 50 metro areas. Next came Charlotte, NC (-19.9%), Jacksonville, FL (-17.3%), Miami (-16.7%) and Orlando, FL (-16.1%).
The only three major metros to post a faster turnover rate from a year ago were Virginia Beach, VA (+5.3%), San Francisco (+2.6%) and Indianapolis (+1.4%)
Homes turning over the least in New York and Californian metros
New York recorded the lowest turnover rate among the top 50 metros, with only around 10 out of every 1,000 homes selling in the first nine months of the year.
| Major U.S. Metros With Lowest Turnover Rates (Jan-Aug 2025) | |||
| Rank | Metro | Sales per 1,000 Homes | YoY Change |
| 1 | New York | 10.3 | -4.0% |
| 2 | Los Angeles | 11.5 | -8.6% |
| 3 | San Francisco | 13.2 | +2.6% |
| 4 | San Jose, CA | 14.8 | -6.2% |
| 5 | Anaheim, CA | 15.5 | -4.9% |
| 6 | Oakland, CA | 15.9 | -2.2% |
| 7 | San Diego | 16.3 | -2.4% |
Next came six California metros, led by Los Angeles (11.5 sales per 1,000 homes), San Francisco (13.2 sales per 1,000 homes) and San Jose, CA (14.8 sales per 1,000 homes).
California’s low housing turnover stems in part from Proposition 13, a state law that restricts property-tax growth and creates a strong financial incentive for homeowners to remain in their homes. It’s worth noting that the increased SALT cap rate may help to unlock some of California’s housing inventory in future years.
Housing Turnover by Metro Area: January-September
50 most populous U.S. metros
| Metro Area | 2025 Sales (Per 1,000 Homes) |
2024 Sales (Per 1,000 Homes) |
YoY Difference |
|---|---|---|---|
| Anaheim, CA | 15.5 | 16.3 | -4.9% |
| Atlanta, GA | 30.1 | 31.5 | -4.6% |
| Austin, TX | 21.7 | 25.9 | -15.9% |
| Baltimore, MD | 22.3 | 23.2 | -4.0% |
| Boston, MA | 18.8 | 19.9 | -5.9% |
| Charlotte, NC | 27.5 | 34.3 | -19.8% |
| Chicago, IL | 22.8 | 23.9 | -4.6% |
| Cincinnati, OH | 24.6 | 25.4 | -3.0% |
| Cleveland, OH | 22.8 | 23.5 | -3.0% |
| Columbus, OH | 26.0 | 27.6 | -5.8% |
| Dallas, TX | 23.0 | 26.3 | -12.6% |
| Denver, CO | 27.0 | 27.8 | -2.8% |
| Detroit, MI | 20.4 | 21.8 | -6.2% |
| Fort Lauderdale, FL | 26.6 | 29.9 | -11.1% |
| Fort Worth, TX | 23.3 | 25.9 | -10.2% |
| Houston, TX | 23.3 | 26.7 | -13.0% |
| Indianapolis, IN | 30.3 | 29.9 | 1.4% |
| Jacksonville, FL | 28.8 | 34.8 | -17.3% |
| Kansas City, MO | 29.0 | 29.6 | -1.8% |
| Las Vegas, NV | 27.0 | 30.5 | -11.3% |
| Los Angeles, CA | 11.5 | 11.8 | -2.5% |
| Miami, FL | 17.9 | 21.5 | -16.7% |
| Milwaukee, WI | 21.4 | 22.9 | -6.8% |
| Minneapolis, MN | 27.4 | 27.8 | -1.4% |
| Montgomery County, PA | 20.1 | 20.3 | -1.2% |
| Nashville, TN | 29.5 | 35.0 | -15.6% |
| Nassau County, NY | 18.2 | 18.6 | -2.5% |
| New Brunswick, NJ | 22.1 | 22.9 | -3.5% |
| New York, NY | 10.3 | 10.7 | -4.0% |
| Newark, NJ | 17.8 | 18.8 | -5.1% |
| Oakland, CA | 15.9 | 16.3 | -2.2% |
| Orlando, FL | 26.2 | 31.2 | -16.1% |
| Philadelphia, PA | 18.3 | 19.3 | -4.9% |
| Phoenix, AZ | 27.8 | 28.4 | -2.2% |
| Pittsburgh, PA | 18.1 | 18.5 | -1.9% |
| Portland, OR | 22.1 | 23.4 | -5.4% |
| Providence, RI | 21.9 | 22.4 | -2.0% |
| Riverside, CA | 23.3 | 24.6 | -5.1% |
| Sacramento, CA | 20.0 | 20.3 | -1.4% |
| San Antonio, TX | 24.1 | 33.0 | -26.9% |
| San Diego, CA | 16.3 | 16.7 | -2.4% |
| San Francisco, CA | 13.2 | 12.9 | 2.6% |
| San Jose, CA | 14.8 | 15.8 | -6.2% |
| Seattle, WA | 19.7 | 21.8 | -9.4% |
| St. Louis, MO | 26.7 | 27.2 | -1.6% |
| Tampa, FL | 31.2 | 36.1 | -13.7% |
| Virginia Beach, VA | 35.2 | 33.4 | 5.3% |
| Warren, MI | 23.3 | 23.9 | -2.4% |
| Washington, DC | 24.3 | 26.0 | -6.6% |
| West Palm Beach, FL | 32.6 | 35.8 | -8.8% |
| United States | 27.7 | 27.8 | -0.4% |
Methodology
Redfin’s analysis of turnover rates is based on MLS data and county records. To calculate the national turnover rate, we adjust Redfin’s measure of existing home sales and new listings to account for off-MLS sales using data from NAR, while metro-level figures do not include these adjustments.
The turnover rate is defined as the number of homes sold divided by the total number of sellable properties (single-family homes, condos/co-ops, and townhomes) that exist in a given area during a given year. The total number of properties is calculated using the previous year’s Census data on owner-occupied and renter-occupied housing stock. The analysis covers the first nine months of each year beginning in 2012, which is as far back as Redfin’s data goes.