
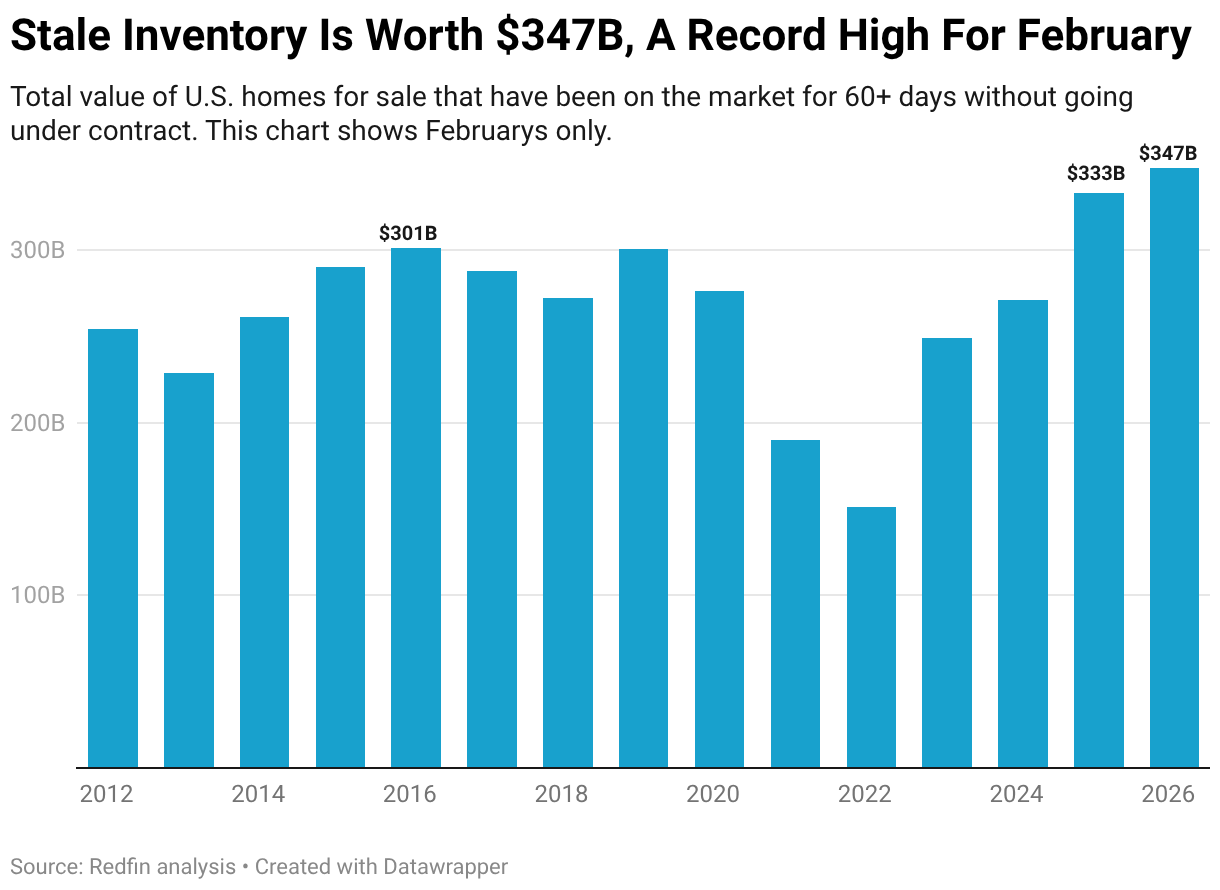
- In dollar terms, there’s $347 billion worth of stale listings in the U.S., more than ever before for this time of year. That’s because there are hundreds of thousands more home sellers than buyers, leading to homes sitting on the market.
- Stale inventory is most common in Florida, and least common in the Bay Area.
- Through Redfin’s new partnership with Compass, sellers can work to avoid stale listings by testing the market, which could reduce the risk of homes lingering on the market.
More than half (52.2%) of February’s home listings were on the market for at least 60 days without going under contract (i.e. they were stale) nationwide, up from 50.1% a year earlier and the highest share since 2019.
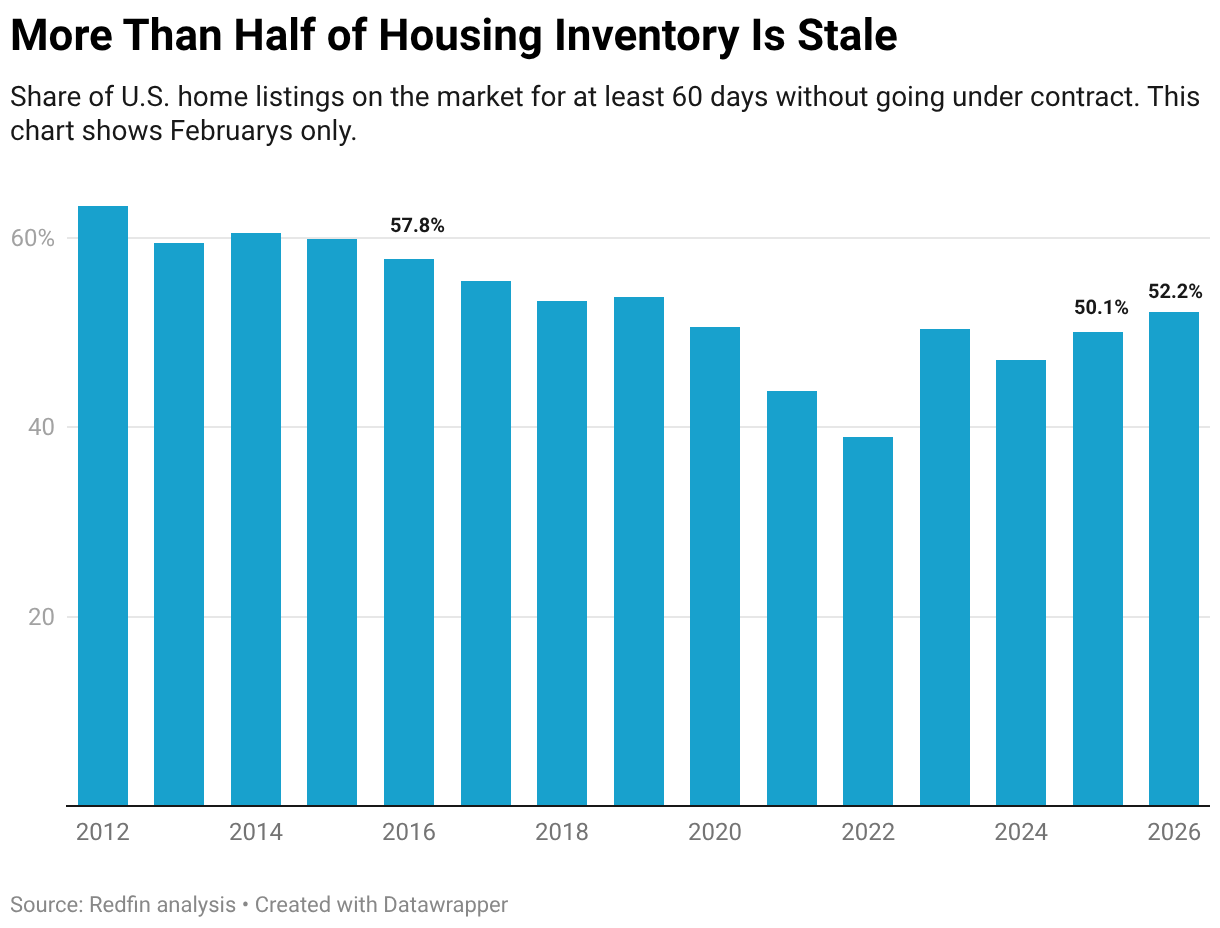
This is based on an analysis of listings on Redfin.com going back through 2012. For the total dollar value of all inventory on the market, we sum up the list price of all active U.S. listings as of the last day of each month; February 2026 is the most recent month for which data is available. We define “stale inventory” as home listings that spend at least 60 days on the market and are actively listed for sale on the final day of the relevant month. This data is seasonal, which is why we compare February to past Februarys. Please see the end of this report for more on methodology.
Home Sellers Are Sitting on $347 Billion Worth of Stale Listings, a Record High For This Time of Year
In dollar terms, there’s a total of $347 billion worth of stale inventory on the market nationwide. That’s up 4.3% annually and the highest dollar amount on record for this time of year.
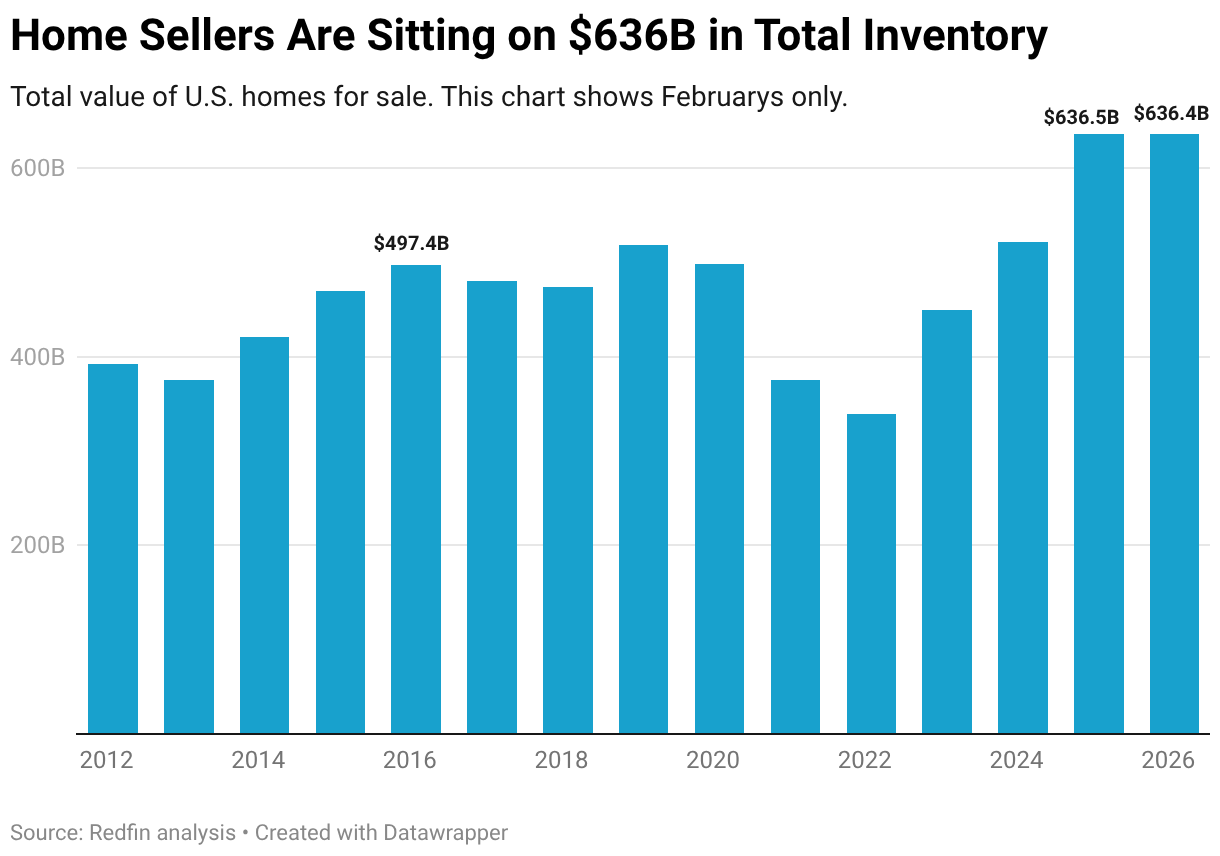
There’s a Total of $636 Billion Worth of Homes For Sale in the U.S.
Zooming out to all inventory, there’s a total of $636 billion worth of homes for sale, essentially unchanged from a year earlier. Like stale inventory, that’s the highest dollar amount on record for this time of year (except 2025, when it was 0.01% higher).
The total value of stale inventory–and all inventory–is higher than ever for this time of year because there are a record 630,000 more home sellers than buyers in the market, lengthening the amount of time it takes to sell a home. Here are more details:
- Homebuying demand is slow. U.S. home sales fell 3.1% year over year in February. House hunters are wary of high mortgage rates and high prices, and they’re jittery because of economic uncertainty, including fears about layoffs, inflation and the Iran war.
- Home selling is chugging along. The total number of homes for sale is up 1.5% year over year. While some sellers have backed off, many are still in the market, hoping to cash in on still-high home values.
- Days on market are at a record high. The typical home that went under contract in February spent 66 days on the market–the slowest pace in a decade for this time of year.
- Home prices are rising. The median home-sale price is up roughly 1% year over year. When home prices increase, so does the total dollar value of homes for sale, and the total dollar value of stale inventory.
“Sellers know it’s a buyer’s market, but they still want to get as much money as they can for their home. So they list on the high end, expecting buyers to negotiate down, and that’s leading to listings staying on the market for a long time,” said Jason Gale, a Redfin Premier agent in New Orleans. “There are still deals to be made, but nine times out of 10, homes are selling for under their asking price. But sometimes, the price is just too high, and sellers have to pull their home off the market after six months or so.”
Stale Listings Are Most Common in Miami
In Miami, nearly two-thirds (62.6%) of home listings are stale, the biggest share of all the major U.S. metros. Next come San Antonio (58.3%), Pittsburgh (58.1%) and West Palm Beach (55.9%).
Listings are going stale in those places because they are major buyer’s markets; in Miami, San Antonio and West Palm Beach, there are more than twice as many home sellers as buyers.
Stale listings are least common in the Bay Area. In San Jose, 19.8% of listings are stale, the smallest share among the major metros, followed by San Francisco (24%) and Oakland (31.1%). Next come Anaheim, CA (34%) and Seattle (34.1%). Most of those are buyer’s markets, but to a much smaller degree than the Florida metros listed above; for instance, in San Jose, there are just 10% more sellers than buyers. San Francisco is a balanced market, with a roughly equal number of sellers and buyers.
Letting Home Sellers Test the Waters Before Listing Could Help Them Sell Faster
Homes lingering on the market can have negative effects for sellers; sometimes, buyers are wary of homes that have been on the market for a long time.
That’s one reason Redfin partnered with Compass on phased marketing, which gives sellers more flexibility in how they introduce their homes to prospective buyers. Sellers can choose to display their homes on Redfin.com with no days on market, no price history and no home valuation estimates.
That allows sellers to gauge early interest in their property and price correctly from the beginning, which we found could help sellers in a few ways:
- Lower the risk of listings going stale. Sellers who test pricing strategies with phased marketing may be less likely to see their homes sit on the market. Overpricing your home by 10% or more can increase time on market by more than a month.
- Lower the risk of losing money from a price drop. Sellers who test pricing using phased marketing may be less likely to lose money via a price cut. Redfin economists estimate that homes sell for less when they have a price cut due to the stigma.
| Metro-Level Summary: Stale Home Listings, Feb. 2026
Home listings are “stale” if they have been on the market for at least 60 days without going under contract |
||
| U.S. metro area | Total dollar value of stale inventory | Share of home listings that are stale |
| Anaheim, CA | $3,804,979,477 | 34.0% |
| Atlanta, GA | $6,967,001,572 | 51.2% |
| Austin, TX | $4,235,317,502 | 53.4% |
| Baltimore, MD | $1,263,200,842 | 47.7% |
| Boston, MA | $2,754,374,299 | 38.7% |
| Chicago, IL | $3,158,224,864 | 40.9% |
| Cincinnati, OH | $1,048,562,696 | 45.6% |
| Cleveland, OH | $610,000,680 | 49.5% |
| Columbus, OH | $993,323,978 | 44.8% |
| Dallas, TX | $5,947,277,162 | 49.3% |
| Denver, CO | $2,733,851,592 | 40.3% |
| Detroit, MI | $463,118,430 | 54.0% |
| Fort Worth, TX | $2,310,252,422 | 50.6% |
| Houston, TX | $7,687,421,473 | 54.5% |
| Indianapolis, IN | $1,104,438,728 | 53.5% |
| Jacksonville, FL | $2,546,738,082 | 51.3% |
| Las Vegas, NV | $3,906,105,308 | 51.3% |
| Los Angeles, CA | $13,531,277,797 | 44.1% |
| Miami, FL | $15,894,396,237 | 62.6% |
| Milwaukee, WI | $508,495,433 | 36.3% |
| Minneapolis, MN | $1,963,662,229 | 43.7% |
| Montgomery County, PA | $857,609,898 | 43.3% |
| Nashville, TN | $5,190,002,567 | 54.8% |
| Nassau County, NY | $3,522,293,691 | 49.2% |
| New Brunswick, NJ | $2,152,388,676 | 47.1% |
| New York, NY | $16,939,740,119 | 55.1% |
| Newark, NJ | $1,006,363,900 | 46.1% |
| Oakland, CA | $903,312,534 | 31.1% |
| Orlando, FL | $4,222,334,231 | 55.7% |
| Philadelphia, PA | $1,179,569,999 | 52.6% |
| Phoenix, AZ | $10,150,809,424 | 46.1% |
| Pittsburgh, PA | $1,158,245,883 | 58.1% |
| Portland, OR | $2,100,910,565 | 48.3% |
| Providence, RI | $796,842,587 | 43.4% |
| Riverside, CA | $5,505,718,830 | 48.8% |
| Sacramento, CA | $1,665,099,987 | 41.8% |
| San Antonio, TX | $3,365,734,572 | 58.3% |
| San Diego, CA | $2,960,305,403 | 37.7% |
| San Francisco, CA | $687,464,464 | 24.0% |
| San Jose, CA | $524,074,518 | 19.8% |
| Seattle, WA | $2,237,074,918 | 34.1% |
| Tampa, FL | $5,980,820,981 | 53.4% |
| Virginia Beach, VA | $977,175,816 | 43.6% |
| Warren, MI | $1,093,257,329 | 46.2% |
| Washington, DC | $3,748,942,561 | 43.9% |
| West Palm Beach, FL | $11,599,537,794 | 55.9% |
| United States of America | $347,358,012,659 | 52.2% |
Methodology
This report is based on an analysis of listings on Redfin.com going back through 2012. For the total dollar value of all inventory on the market, we sum up the list price of all active U.S. listings as of the last day of each month; February 2026 is the most recent month for which data is available. Listings are included in the total if they were added on or before the last day of the month, and are still active (not sold or delisted) as of the last day of the month. Listings were excluded if the list price was higher than $300 million.
For the purposes of this report, the term “value” is interchangeable with “asking price”; i.e., when we refer to “total home value,” we mean the sum of all list prices.
For the stale inventory section of this report, we define “stale inventory” as home listings that spend at least 60 days on the market and are actively listed for sale on the final day of the relevant month. Listings that have been on the market for more than one year are excluded from the analysis.
The data in both the dollar value and stale inventory sections of this report tend to be seasonal; they are generally higher during the spring and summer, and lower in the winter.