
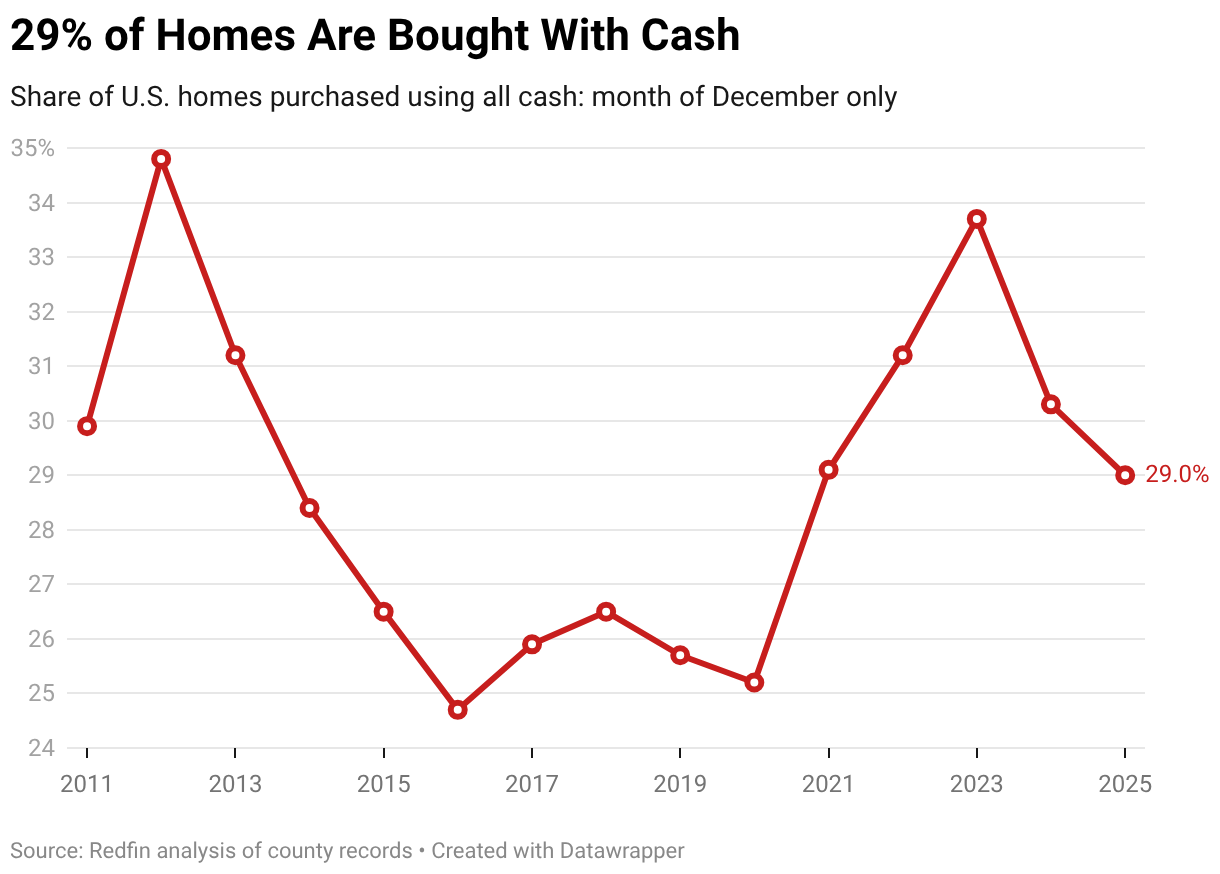
- 29% of homebuyers paid with cash in December—the lowest share for that month since 2020—as a drop in mortgage rates diminished the benefits of paying in cash.
- Cash purchases were most common in Florida and least common on the West Coast.
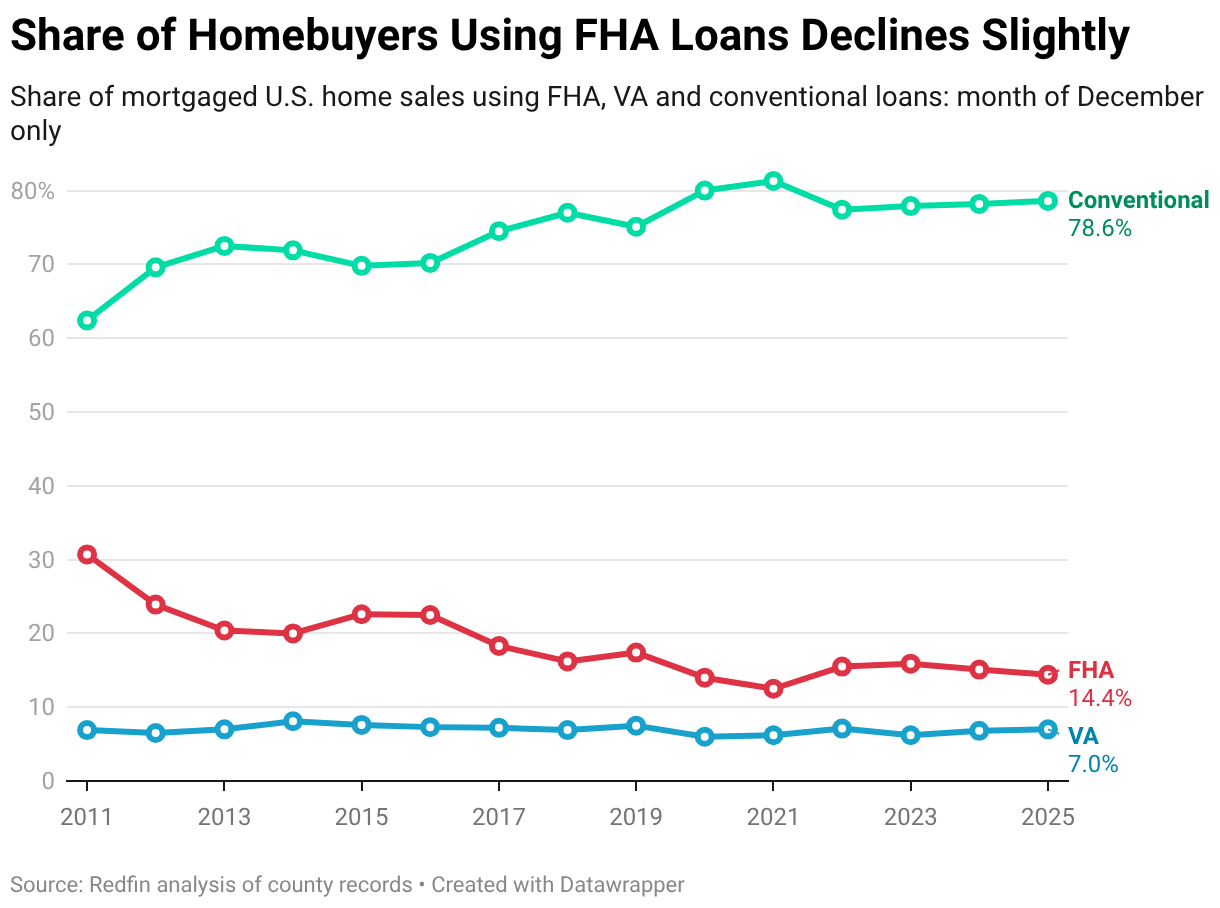
- 14% of buyers who took out mortgages used FHA loans—the lowest December share in four years. The share of buyers using conventional loans and VA loans rose slightly.
Just under 3 in 10 (29%) U.S. homebuyers paid in all cash in December, down from 30.3% a year earlier and the lowest December share since 2020.
The data in this report is from a Redfin analysis of county records across 38 of the most populous U.S. metropolitan areas. December 2025 is the most recent month for which data is available. An all-cash purchase is one in which there is no mortgage loan information on the deed.
The share of homebuyers paying in cash peaked at nearly 35% in late 2023 because mortgage rates peaked in the high-7% range around that time. Buyers were inclined to pay in cash—if they could afford it—to avoid high monthly interest payments.
When mortgage rates came down from their peak, all-cash payments became less common, as lower rates meant lower interest payments. The average 30-year-fixed mortgage rate currently sits at 6.09%.
Another reason the share of buyers paying in cash has declined: It’s the strongest buyer’s market in recent history. Sellers outnumber buyers by a record 47%, giving the buyers who are in the market negotiating power. Buyers aren’t facing much competition, which means they don’t have to pull out all of the stops (such as offering all cash and waiving contingencies) to woo sellers like they did during the pandemic homebuying frenzy.
While most buyers today don’t need to pay in cash to win a home, paying in cash can still help buyers get better deal terms. Sellers in some areas—especially Texas and Florida—are watching their homes sit on the market for months without showings. That makes cash deals all the more attractive because they typically close faster than deals in which the buyer takes out a loan.
“The leverage buyers have when they pay in cash is unbelievable,” said Amanda Peterson, a Redfin Premier real estate agent in Dallas. “It’s not uncommon to see a buyer score a home for 10-20% below the appraised value if they offer cash.”
Share of Buyers Using FHA Loans Falls to Four-Year Low
Roughly 1 in 7 (14.4%) homebuyers who took out mortgages used FHA loans in December, down from 15.1% a year earlier and the lowest December share since 2021.
FHA loans are insured by the U.S. government and meant for low-to-moderate-income borrowers. They’re popular with first-time homebuyers because they have lower financial requirements than conventional loans; typically, they require a 3.5% down payment.
“A lot of homebuyers—especially FHA buyers—are getting cold feet when they see the actual monthly payment and the amount of money they need to bring to the table at closing,” said John Tomlinson, a Redfin Premier real estate agent in Fort Lauderdale, FL. “They may only have a 3.5% down payment, but with prepaid taxes and mortgage insurance, closing costs can be $20,000–$30,000. Rising HOA fees are adding insult to injury.”
One might expect to see an uptick in the share of buyers using FHA loans given that housing costs are high and homebuyer competition is low. But FHA loans may actually be on the decline because housing costs are high. Many low-to-moderate-income Americans—the population that typically uses FHA loans—have been priced out of the housing market. That may explain why we’re seeing a rising share of buyers using conventional loans.
Over three-quarters (78.6%) of mortgaged homebuyers used conventional loans in December, up slightly from 78.2% a year earlier and the highest December share since 2021.
It’s worth noting that FHA mortgage rates have declined this month and are lower than the typical 30-year-fixed rate, which may bring more FHA buyers off the sidelines.
VA loans, which are available to veterans, service members and their surviving spouses, were used in 7% of mortgaged home purchases in December, up very slightly from 6.8% a year earlier. VA loans require little to no down payment. You can read more about the recent uptick in VA loans here.
Metro-Level Highlights
The data below represents December 2025 and covers 38 of the most populous U.S. metros.
All-cash purchases
- All-cash purchases were most prevalent in West Palm Beach, FL, where 47.2% of buyers paid in cash. Next came Jacksonville, FL (39.3%) and Miami (39.3%).
- They were least prevalent in Seattle (17.3%), Oakland, CA (18.5%) and Sacramento, CA (19.6%).
- The share of buyers paying in cash increased most in Providence, RI, Atlanta and Denver.
- The share of buyers paying in cash decreased most in Milwaukee, Phoenix and Cleveland.
FHA loans
- FHA loans were most prevalent in Riverside, CA, where 25.6% of mortgaged homebuyers used one. Next came Las Vegas (24%) and Atlanta (21%).
- They were least prevalent in San Francisco (1.1%), San Jose (4.3%) and Anaheim (5.8%).
- The share of buyers using FHA loans increased most in San Jose, Atlanta and Cincinnati.
- The share of buyers using FHA loans decreased most in Providence, Cleveland and Jacksonville.
VA loans
- VA loans were most prevalent in Virginia Beach, VA, where 36.8% of mortgaged homebuyers used one. Next came Jacksonville (19.6%) and San Diego (16.8%).
- They were least prevalent in San Francisco (0.7%), San Jose (1.8%) and New York (1.9%).
- The share of buyers using VA loans increased most in Jacksonville, San Diego and Orlando, FL.
- The share of buyers using VA loans decreased most in Virginia Beach, Milwaukee and Sacramento.
Conventional loans
- Conventional loans were most prevalent in San Francisco, where 98.1% of mortgaged homebuyers used one. Next came San Jose (93.9%) and Anaheim (90.6%).
- They were least prevalent in Virginia Beach (47%), Jacksonville (65%) and Las Vegas (65.1%).
- The share of buyers using conventional loans increased most in Cleveland, Providence and Tampa, FL.
- The share of buyers using conventional loans decreased most in Atlanta, San Jose and Anaheim.
| U.S. metro area | Share of buyers paying cash | YoY change in share of buyers paying cash | Share of mortgaged buyers using FHA loans | YoY change in share of mortgaged buyers using FHA loans | Share of mortgaged buyers using VA loans | YoY change in share of mortgaged buyers using VA loans | Share of mortgaged buyers using conventional loans | YoY change in share of mortgaged buyers using conventional loans |
|---|---|---|---|---|---|---|---|---|
| Anaheim, CA | 27.0% | -1.5 ppts | 5.8% | 0.9 ppts | 3.5% | 1.5 ppts | 90.6% | -2.3 ppts |
| Atlanta, GA | 36.3% | 4.7 ppts | 21.0% | 2.0 ppts | 7.7% | 1.3 ppts | 71.2% | -3.3 ppts |
| Baltimore, MD | 33.7% | -2.8 ppts | 15.5% | -2.2 ppts | 7.8% | -0.9 ppts | 76.7% | 3.1 ppts |
| Charlotte, NC | 30.3% | -3.4 ppts | 13.2% | -0.1 ppts | 6.8% | 0.3 ppts | 79.9% | -0.1 ppts |
| Chicago, IL | 24.8% | -1.0 ppts | 13.3% | -1.1 ppts | 3.3% | 0.2 ppts | 83.5% | 0.9 ppts |
| Cincinnati, OH | 35.7% | 1.5 ppts | 17.3% | 2.0 ppts | 5.6% | 0.3 ppts | 77.1% | -2.3 ppts |
| Cleveland, OH | 38.5% | -6.4 ppts | 12.6% | -4.5 ppts | 5.4% | -0.3 ppts | 81.9% | 4.8 ppts |
| Columbus, OH | 27.3% | -0.5 ppts | 15.2% | 1.9 ppts | 6.6% | -0.1 ppts | 78.2% | -1.8 ppts |
| Denver, CO | 29.0% | 3.0 ppts | 16.0% | 0.5 ppts | 6.8% | 0.1 ppts | 77.2% | -0.6 ppts |
| Fort Lauderdale, FL | 35.8% | -2.3 ppts | 19.0% | 0.3 ppts | 3.8% | 0.0 ppts | 77.3% | -0.2 ppts |
| Jacksonville, FL | 39.3% | 0.8 ppts | 15.4% | -4.1 ppts | 19.6% | 3.1 ppts | 65.0% | 1.0 ppts |
| Las Vegas, NV | 28.0% | -3.5 ppts | 24.0% | -0.9 ppts | 10.9% | 0.3 ppts | 65.1% | 0.5 ppts |
| Los Angeles, CA | 20.8% | -0.2 ppts | 14.0% | 0.6 ppts | 3.2% | 0.1 ppts | 82.7% | -0.7 ppts |
| Miami, FL | 39.3% | 0.9 ppts | 14.7% | -2.0 ppts | 2.7% | 0.0 ppts | 82.6% | 2.0 ppts |
| Milwaukee, WI | 24.2% | -9.5 ppts | 9.3% | 0.1 ppts | 3.0% | -1.5 ppts | 87.7% | 1.4 ppts |
| Minneapolis, MN | 28.3% | 0.1 ppts | 9.8% | 0.8 ppts | 5.4% | 1.3 ppts | 84.8% | -2.2 ppts |
| Montgomery County, PA | 29.0% | -1.1 ppts | 7.1% | -2.1 ppts | 4.9% | 0.8 ppts | 88.0% | 1.3 ppts |
| Nashville, TN | 30.2% | -4.5 ppts | 15.8% | -2.7 ppts | 7.1% | -0.5 ppts | 77.0% | 3.2 ppts |
| New Brunswick, NJ | 31.9% | -0.7 ppts | 9.6% | -1.5 ppts | 3.9% | 0.7 ppts | 86.6% | 0.8 ppts |
| New York, NY | 30.4% | -4.0 ppts | 8.7% | 0.9 ppts | 1.9% | 0.1 ppts | 89.5% | -1.0 ppts |
| Newark, NJ | 21.2% | -0.2 ppts | 12.3% | -3.4 ppts | 3.1% | -0.2 ppts | 84.6% | 3.6 ppts |
| Oakland, CA | 18.5% | 2.6 ppts | 8.1% | 0.5 ppts | 2.1% | 0.3 ppts | 89.8% | -0.8 ppts |
| Orlando, FL | 34.1% | 0.3 ppts | 18.3% | -1.8 ppts | 8.9% | 1.9 ppts | 72.8% | -0.1 ppts |
| Philadelphia, PA | 33.8% | -0.6 ppts | 18.6% | 1.3 ppts | 3.2% | 0.3 ppts | 78.3% | -1.6 ppts |
| Phoenix, AZ | 26.5% | -6.9 ppts | 18.0% | -0.9 ppts | 8.0% | 0.2 ppts | 74.0% | 0.7 ppts |
| Portland, OR | 22.0% | 1.4 ppts | 13.1% | -3.0 ppts | 5.1% | 0.4 ppts | 81.8% | 2.7 ppts |
| Providence, RI | 28.4% | 7.5 ppts | 19.9% | -4.7 ppts | 6.4% | 0.5 ppts | 73.7% | 4.2 ppts |
| Riverside, CA | 24.4% | -5.8 ppts | 25.6% | 0.1 ppts | 8.9% | 1.7 ppts | 65.5% | -1.8 ppts |
| Sacramento, CA | 19.6% | -2.8 ppts | 14.8% | 0.2 ppts | 5.2% | -1.4 ppts | 80.1% | 1.2 ppts |
| San Diego, CA | 20.0% | -2.1 ppts | 8.6% | -1.5 ppts | 16.8% | 2.4 ppts | 74.6% | -1.0 ppts |
| San Francisco, CA | 24.4% | -3.8 ppts | 1.1% | -1.0 ppts | 0.7% | -0.7 ppts | 98.1% | 1.7 ppts |
| San Jose, CA | 20.2% | 2.7 ppts | 4.3% | 2.1 ppts | 1.8% | 1.0 ppts | 93.9% | -3.1 ppts |
| Seattle, WA | 17.3% | -1.3 ppts | 6.0% | -1.5 ppts | 5.1% | 1.7 ppts | 88.9% | -0.2 ppts |
| Tampa, FL | 34.9% | -3.9 ppts | 19.4% | -3.4 ppts | 10.1% | -0.5 ppts | 70.5% | 4.0 ppts |
| Virginia Beach, VA | 22.2% | 0.0 ppts | 16.2% | 0.5 ppts | 36.8% | -3.2 ppts | 47.0% | 2.7 ppts |
| Warren, MI | 30.9% | 0.4 ppts | 11.5% | -0.1 ppts | 3.7% | -0.6 ppts | 84.8% | 0.7 ppts |
| Washington, DC | 21.5% | 0.0 ppts | 12.7% | -1.4 ppts | 14.3% | -0.1 ppts | 73.0% | 1.5 ppts |
| West Palm Beach, FL | 47.2% | -3.0 ppts | 13.6% | -2.2 ppts | 3.0% | -1.0 ppts | 83.4% | 3.2 ppts |