
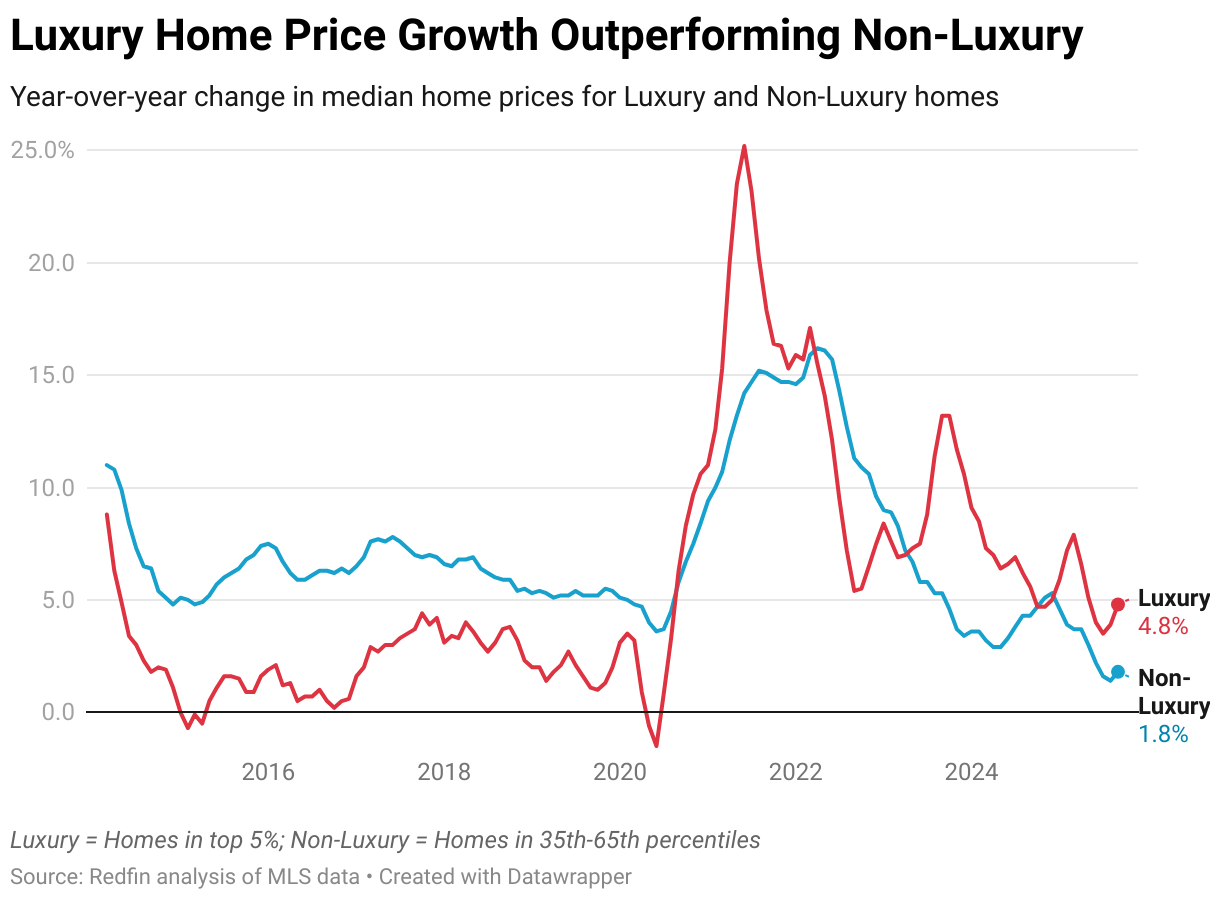
- The typical U.S. luxury home sold for $1,262,000 in September, up 4.8% from a year earlier to a record high for the month.
- Luxury home sales were essentially unchanged (+0.3%) from a year earlier, showing signs of stabilization after last year’s sharp slowdown. Non-luxury home sales fell 0.3% year over year, remaining near their lowest level since at least 2013.
- The typical luxury home took 52 days to go under contract, six days slower than last year. In comparison, non-luxury homes sold in a median of 43 days, seven days slower than a year ago.
- Luxury home prices rose most in West Palm Beach, FL (+14.8%) and fell most in Tampa, FL (-3.3%).
The typical U.S. luxury home sold for $1.26 million in September, up 4.8% from a year earlier and a record high for the month. That’s more than twice the pace of price growth for non-luxury homes, which rose 1.8% year over year to a median of $371,583.
That’s according to an analysis of home sales from July through September 2025. Redfin defines luxury homes as those estimated to be in the top 5% of their metro area’s price range, while non-luxury homes fall into the middle 35th–65th percentile. All figures are based on rolling three-month periods and are subject to revision.
Luxury prices are outpacing non-luxury
Prices of luxury homes have been rising faster than prices of non-luxury homes for most of the past two years. The typical luxury home price has climbed about 11% since September 2023, compared with roughly 6% growth for non-luxury homes.
“Luxury prices are outpacing the rest of the market because the people buying at the top end are playing by different rules,” said Redfin Senior Economist Sheharyar Bokhari. “They’re not waiting for rates to drop or prices to fall—they have the cash, stock gains, and long-term confidence to act when they see a home they want. Some high-end buyers are also using real estate as a safe place to park their money amid economic uncertainty. That demand, even at a smaller scale, is enough to keep pushing luxury prices up faster than the broader market.”
That widening gap reflects how high-end buyers—many of whom pay in cash or take smaller loans—have stayed active even as affordability challenges priced many middle-income buyers out of the market. High mortgage rates and record home prices have made purchasing a home far more expensive than before the pandemic, and many middle-income Americans are waiting for affordability to improve before jumping back in.
Luxury and non-luxury home sales are stable, but near record lows
Luxury (+0.3%) and non-luxury (-0.3%) home sales were essentially flat from a year earlier, hovering near the lowest September levels in records going back to 2012.
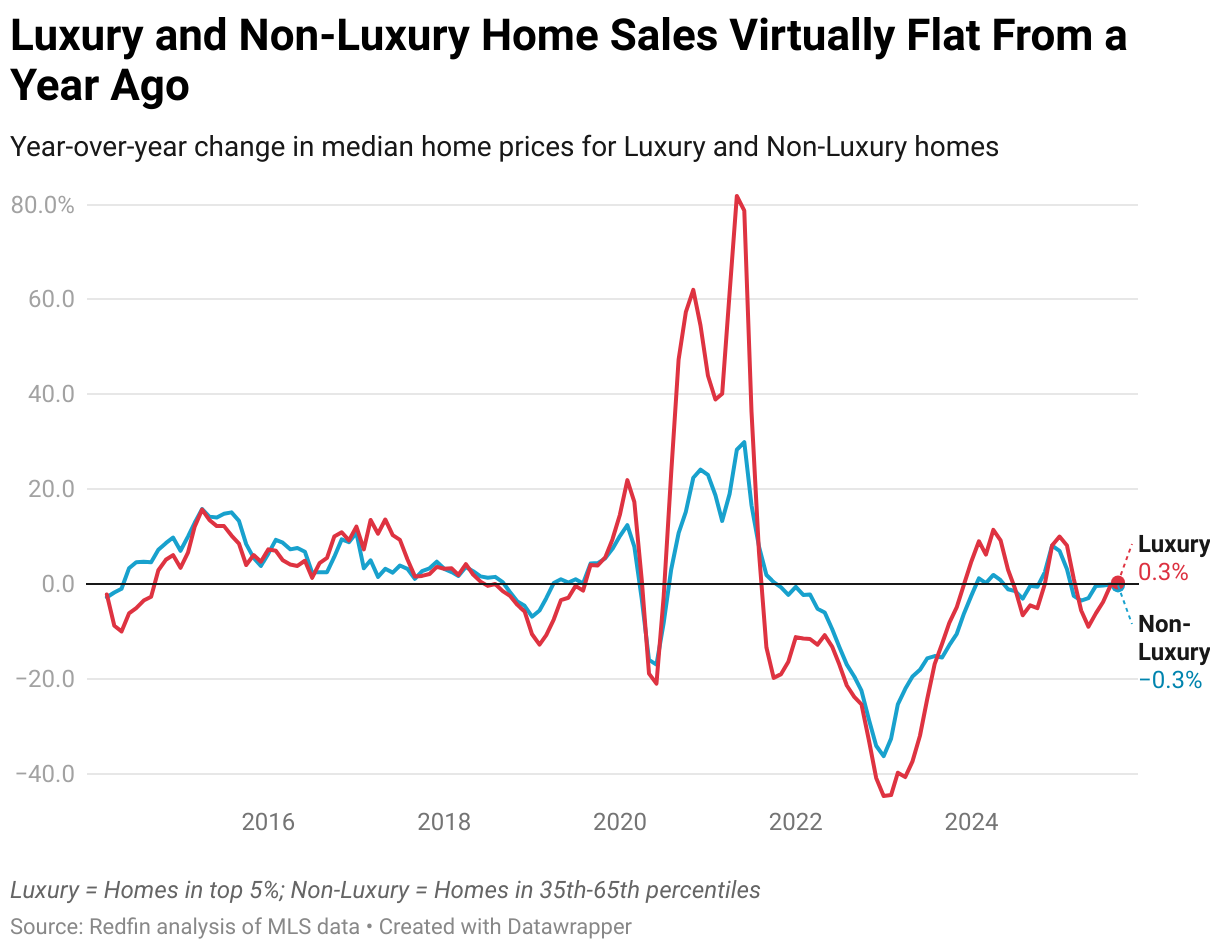
Pending sales—a leading indicator of future closings—rose 1.6% for luxury homes and 1% for non-luxury homes from a year earlier. While that’s a modest improvement, it comes on the heels of one of the slowest years for home sales in more than a decade. The small year-over-year uptick suggests that sales are hovering just above their low point rather than meaningfully rebounding.
Luxury home inventory climbs 7.7% from a year earlier
The number of luxury homes for sale climbed 7.7% year over year to the highest September level since 2020. Non-luxury inventory rose even more—11.4%—to the highest level for any September since 2019.
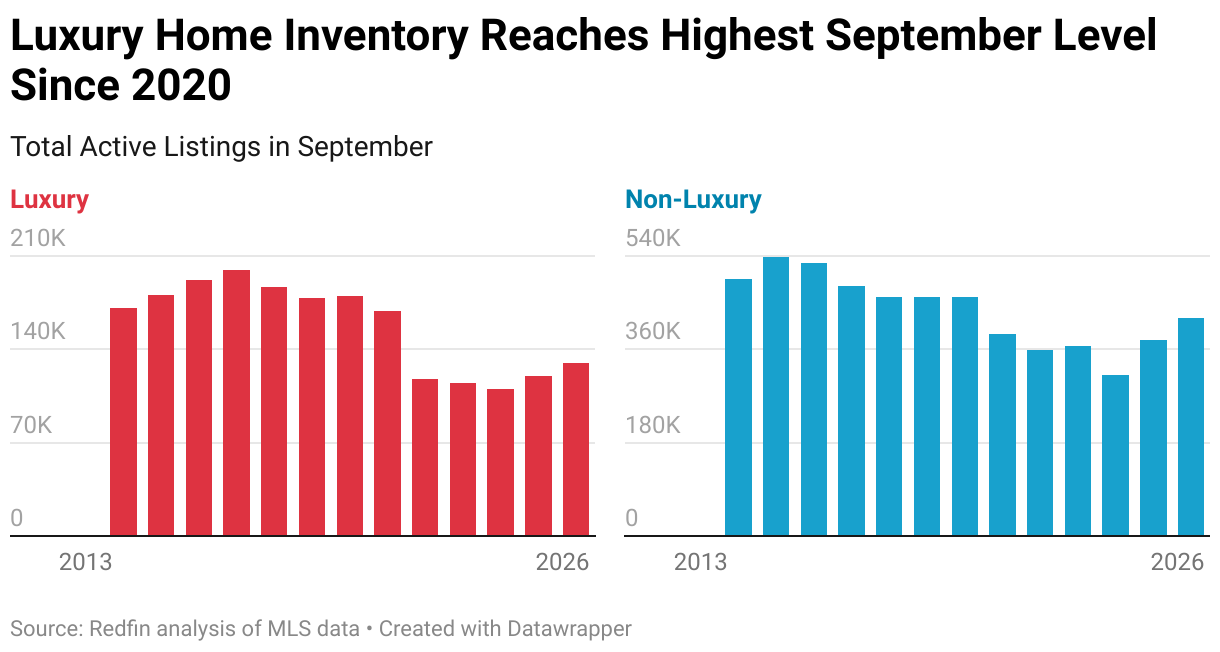
Luxury listings are still well below pre-pandemic levels. There were nearly 50% fewer luxury listings in September than a decade earlier, while there were 25% fewer non-luxury listings.
“There’s definitely a stronger demand for luxury homes, because those buyers are less worried about interest rates,” said Rebecca Love, a Redfin real estate agent in Washington, D.C. “But there’s also really limited luxury inventory in our area, and that’s keeping demand high and pushing prices higher.”
New listings of luxury homes were roughly unchanged from a year earlier, while non-luxury listings slipped 1.3%.
Luxury and non-luxury homes are taking roughly a week longer to sell than last year
The typical luxury home took 52 days to sell in September—six days longer than last year and the slowest pace for any September since 2020. Only 27.3% of luxury listings went under contract within two weeks, down from 28.3% last year.
Non-luxury homes also took longer to sell, spending a median of 43 days on the market, up from 36 a year earlier. About one-third (32.7%) of those homes found buyers within two weeks, down from 36.1% last year.
Metro-Level Luxury Highlights: September 2025
Redfin’s metro-level luxury data includes the 50 most populous U.S. metros. All changes below are year over year.
- Prices: Luxury prices rose most in West Palm Beach, FL (+14.8% to $4.13 million), Newark, NJ (+12.3% to $2.05 million), and Virginia Beach, VA (+11.2% to $1.07 million. The only two metros where prices dropped were Tampa, FL (-3.3% to $1.45 million) and Oakland, CA (-2.2% to $2.9 million).
- Sales: Luxury sales rose most in San Francisco (+30.5%), Providence, RI (+19.1%) and Fort Worth, TX (+13.5%). They fell most in West Palm Beach (-22.4%), San Jose, CA (-20.8%) and Philadelphia (-16.8%).
- Active Listings: Luxury inventory grew fastest in Tampa (+31.1%), Fort Worth (+18.7%), and Nashville, TN (+18.6%). It declined most in Philadelphia (-21.6%), San Jose (-20.0%), and Chicago (-14.8%).
- New Listings: New luxury listings rose most in Tampa (+21.5%), Kansas City, MO (+20.6%), and San Francisco (+20.0%). They fell most in Jacksonville, FL (-22.6%), Anaheim, CA (-19%), and New York (-16.5%).
- Speed of Sales: Luxury homes sold fastest in San Jose (14 days), St. Louis (16 days) and Detroit (16 days). They sold slowest in Miami (130 days), West Palm Beach (115 days), and Fort Lauderdale, FL (114 days).
Luxury Housing-Market by Metro Area: September 2025
50 most populous U.S. metros
Luxury homes are defined as those estimated to be in the top 5% of their respective metro area based on prices of homes sold over a rolling 12-month period
| Metro | Median Sale Price | Median Sale Price Yoy | Homes Sold Yoy | Pending Sales Yoy | Active Listings Yoy | Median Days On Market |
|---|---|---|---|---|---|---|
| Anaheim, CA | $5,063,978 | 7.6% | -2.9% | -6.7% | -0.3% | 87 |
| Atlanta, GA | $1,382,327 | 5.9% | -7.1% | -9.5% | 1.4% | 54 |
| Austin, TX | $1,690,544 | 0.3% | 0.5% | 3.0% | -4.0% | 90 |
| Baltimore, MD | $1,237,329 | 8.4% | -1.4% | -0.2% | 18.2% | 41 |
| Boston, MA | $2,685,412 | 3.2% | 1.7% | 15.8% | 9.0% | 36 |
| Charlotte, NC | $1,623,745 | 7.8% | -5.4% | 1.5% | 3.8% | 61 |
| Chicago, IL | $1,483,746 | 6.3% | -7.5% | -5.1% | -14.8% | 56 |
| Cincinnati, OH | $949,872 | 7.5% | -9.6% | -8.8% | -1.9% | 49 |
| Cleveland, OH | $807,026 | 7.6% | -4.3% | 15.9% | 11.1% | 30 |
| Columbus, OH | $951,899 | 3.8% | -1.1% | -0.7% | 13.0% | 44 |
| Dallas, TX | $1,576,278 | 6.4% | -4.0% | -1.0% | 14.3% | 61 |
| Denver, CO | $1,871,916 | 2.5% | 4.9% | -5.7% | 8.5% | 47 |
| Detroit, MI | $719,484 | 1.6% | -14.1% | -12.6% | -1.8% | 16 |
| Fort Lauderdale, FL | $2,085,748 | 6.9% | -11.5% | -6.6% | -0.6% | 114 |
| Fort Worth, TX | $1,198,363 | 3.9% | 13.5% | 7.4% | 18.7% | 52 |
| Houston, TX | $1,281,361 | 4.1% | 0.6% | -4.4% | 6.5% | 43 |
| Indianapolis, IN | $937,865 | 3.5% | 11.7% | 15.4% | 10.2% | 22 |
| Jacksonville, FL | $1,466,739 | 1.7% | -1.1% | 4.3% | -1.7% | 84 |
| Kansas City, MO | $1,041,455 | 7.0% | 8.8% | 12.7% | -3.0% | 32 |
| Las Vegas, NV | $1,572,354 | 7.9% | -9.6% | 3.2% | 14.9% | 76 |
| Los Angeles, CA | $4,462,496 | 7.5% | 6.2% | 10.0% | 4.5% | 68 |
| Miami, FL | $4,210,805 | 8.4% | -6.6% | -3.2% | -3.5% | 130 |
| Milwaukee, WI | $1,103,268 | 6.1% | 3.7% | 4.4% | -2.7% | 58 |
| Minneapolis, MN | $1,204,087 | 2.2% | 2.4% | 2.4% | 2.0% | 33 |
| Montgomery County, PA | $1,495,400 | 8.1% | -1.1% | -3.3% | 2.2% | 38 |
| Nashville, TN | $2,145,186 | 8.2% | 7.0% | 11.8% | 18.6% | 86 |
| Nassau County, NY | $2,541,699 | 6.2% | -3.0% | -9.8% | -1.7% | 37 |
| New Brunswick, NJ | $1,886,511 | 5.3% | -6.1% | -1.1% | -10.0% | 33 |
| New York, NY | $4,113,698 | 9.8% | 1.6% | -12.6% | 5.0% | 62 |
| Newark, NJ | $2,045,581 | 12.3% | -7.6% | 9.6% | -7.2% | 35 |
| Oakland, CA | $2,895,383 | -2.2% | 1.5% | 1.6% | 13.0% | 19 |
| Orlando, FL | $1,415,285 | 6.6% | -0.5% | -10.2% | -3.8% | 48 |
| Philadelphia, PA | $1,321,864 | 7.9% | -16.8% | -20.7% | -21.6% | 39 |
| Phoenix, AZ | $1,938,259 | 4.7% | -4.7% | 3.4% | 6.5% | 92 |
| Pittsburgh, PA | $881,865 | 1.6% | -7.0% | -0.3% | 1.7% | 60 |
| Portland, OR | $1,434,516 | 2.1% | -4.0% | 6.0% | 9.8% | 42 |
| Providence, RI | $1,636,324 | 9.1% | 19.1% | 5.7% | 1.4% | 38 |
| Riverside, CA | $1,584,646 | 1.7% | 6.7% | 11.3% | 9.5% | 77 |
| Sacramento, CA | $1,764,144 | 4.9% | 7.1% | 12.6% | 7.4% | 58 |
| San Antonio, TX | $962,524 | 3.1% | 4.5% | 8.2% | 13.7% | 81 |
| San Diego, CA | $3,716,448 | 8.2% | -0.6% | 0.0% | 7.8% | 63 |
| San Francisco, CA | $6,080,935 | 2.7% | 30.5% | 25.0% | -5.0% | 23 |
| San Jose, CA | $5,429,257 | 7.7% | -20.8% | -10.3% | -20.0% | 14 |
| Seattle, WA | $3,010,304 | 4.3% | -14.8% | -4.1% | 13.7% | 22 |
| St. Louis, MO | $950,000 | 3.0% | 10.7% | 19.5% | 11.5% | 16 |
| Tampa, FL | $1,445,021 | -3.3% | -0.3% | 7.5% | 31.1% | 53 |
| Virginia Beach, VA | $1,069,112 | 11.2% | 9.2% | -0.2% | 12.0% | 40 |
| Warren, MI | $1,048,219 | 10.8% | -6.9% | -16.1% | -8.0% | 26 |
| Washington, DC | $1,973,528 | 4.0% | -1.3% | 2.0% | 9.4% | 52 |
| West Palm Beach, FL | $4,132,493 | 14.8% | -22.4% | 8.9% | 2.5% | 115 |