
- There are an estimated 1.43 million homebuyers in the U.S. housing market—the lowest level in records dating back to 2013 aside from the start of the pandemic.
- That’s making sellers skittish; the number of sellers has dipped by roughly 14,000 since May, falling for the first time in two years.
- Still, there are 36% more sellers than buyers—the largest gap in records dating back to 2013. That means buyers hold the cards in most markets, especially Texas and Florida. There are only five remaining seller’s markets.
- The good news? Mortgage rates have been falling recently, which could bring some buyers and sellers back to the market.
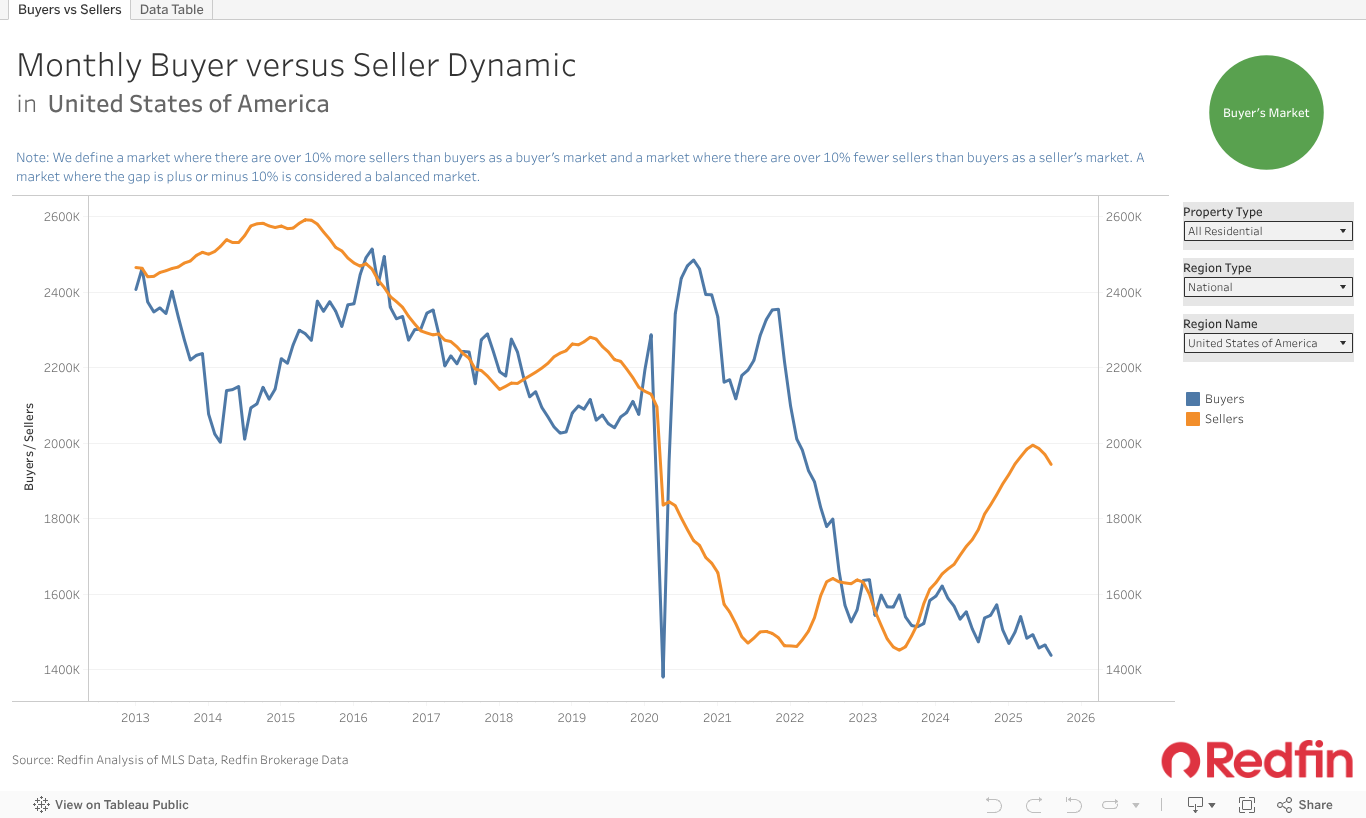
The U.S. housing market has lost about 14,000 home sellers over the past two months, with the total number of sellers falling to 1.95 million in July from a peak of 1.96 million in May. This marks the first decline since July 2023, when the supply of homes for sale bottomed out near a historic low as rising mortgage rates made homeowners reluctant to sell.
Still, sellers outnumber buyers by the widest margin in records dating back to 2013; there were an estimated 1.43 million homebuyers in the housing market in July—the lowest level on record aside from the onset of the pandemic, when the housing market ground to a halt.
The estimated number of sellers in the market is simply the number of active listings in the MLS. We estimated the number of buyers using proprietary Redfin data on the typical time from a buyer’s first tour to close of purchase, and MLS data on active listings and pending sales. If we know how long the typical buyer shops for (time from first tour to close), and we also know how many homes are on the market (active listings) and selling (pending sales), then we can infer the number of buyers in the market. These estimates, along with median-sale price data in this report, are seasonally adjusted and subject to revision. See a more detailed methodology here, and scroll down in this report or visit the Redfin Data Center for data on the 50 most populous U.S. metropolitan areas.
Up until recently, the number of sellers in the market was growing. That’s partly because the mortgage-rate lock-in effect was easing and partly because homes have been taking a long time to sell, causing stale listings to pile up. Redfin reported in May that the number of sellers in the market had hit a five-year high, and predicted that sellers would start to change their tune once they realized it was a buyer’s market. That is now happening.
“Homebuyers are spooked by high home prices, high mortgage rates and economic uncertainty, and now sellers are spooked because buyers are spooked,” said Redfin Senior Economist Asad Khan. “Some sellers are delisting their homes or choosing not to list at all after seeing other houses sit on the market for weeks or months, only to fetch less than the asking price.”
Because sellers are pulling back, inventory is starting to tick down, which is likely why home prices are now heating up slightly. The median home sale price rose 1.4% year over year in July to $434,189—the highest July level on record. By comparison, prices rose 1.2% year over year in June and 1.1% year over year in May. This is notable because at the beginning of the year, home-price growth was shrinking.
It’s the Most Buyer-Friendly Market in Years…If You Can Afford to Buy
There are 36.3% more sellers in the market than buyers (or 518,801 more, to be exact)—the largest gap in records dating back to 2013. In other words, it’s a buyer’s market—at least nationally—and has been for the past 15 months.
We define a market where there are over 10% more sellers than buyers as a buyer’s market and a market where there are over 10% fewer sellers than buyers as a seller’s market. A market where the gap is plus or minus 10% is considered a balanced market.
“We’re likely in the most buyer-friendly housing market since the 2008 financial crisis,” Khan said. “Back then, inventory piled up as foreclosures surged, and demand was weak, meaning buyers had negotiating power. We’re not headed for another 2008, though; many of today’s homeowners have built substantial equity thanks to the recent surge in home values, and today’s borrowers must meet stricter lending standards. Plus, there are more options for avoiding foreclosure if a homeowner is at risk of defaulting, such as loan modification.”

Of course, it’s only a buyer’s market for those who can afford to buy. Many Americans have been priced out of the housing market altogether in recent years—mortgage rates are more than double their pandemic low, and home prices at a record high for this time of year. The good news is that mortgage rates have dropped in recent weeks, which could bring some buyers off of the sidelines.
Miami and Fort Lauderdale Are the Strongest Buyer’s Markets, With Over Twice as Many Sellers as Buyers
In Miami, there are an estimated 21,637 home sellers and 8,293 homebuyers. That means there are 160.9% more sellers than buyers—the largest imbalance among the 50 most populous U.S. metropolitan areas. It’s followed by Fort Lauderdale, FL (151.2% more sellers than buyers), Austin, TX (123.8%), West Palm Beach, FL (123.4%) and San Antonio (113.1%).
Overall, 35 of the 50 most populous metros are buyer’s markets, 10 are balanced markets and five are seller’s markets. The buyer’s markets are concentrated in the Sun Belt and on the West Coast, while balanced markets and seller’s markets skew more toward the Midwest and East Coast.
“It’s a true buyer’s market in San Antonio. Buyers are patient, selective, value conscious, and aware of their increased negotiating power. When they make offers, they ask for the moon,” said local Redfin Premier real estate agent Jesse Landin. “Sellers are struggling to adapt—their expectations are anchored to 2021, when homes were flying off the market for thousands of dollars over the asking price. A growing number are exploring alternatives. Some are entertaining low-ball offers from investors or even foreclosure. Others are considering pulling their home off the market and becoming a landlord if they don’t achieve their desired asking price. The problem is that the rental market is also slow.”
Landin has one client who bought his home in 2020 and has been renting it out since, but recently chose to put it up for sale because he has been struggling to find tenants. Now he’s considering delisting the property and trying to rent it out again because it’s been sitting for four months without a buyer.
The Sun Belt skyrocketed in popularity during the pandemic, when scores of homebuyers moved in from more expensive parts of the country, driving up housing costs and pricing many locals out of the market. To meet surging demand, homebuilders ramped up activity, which is one reason there are now a lot more homes for sale than people who want to buy them. Landin noted that many newly-built homes in San Antonio don’t show up in the MLS, meaning inventory numbers may be understated.
“Regular sellers are competing with homebuilders for buyers,” Landin said. “If your house was built three years ago and has the same floorplan as a newbuild down the road, you have to list it for less than the newbuild, especially because builders are offering all sorts of powerful incentives to woo buyers. This is putting major pressure on individual sellers—particularly those who bought at the peak of the pandemic market and need to recoup their investment.”
Texas and Florida continue to build more homes than other states. Florida is also grappling with intensifying natural disasters, soaring insurance premiums and rising condo HOA fees, which has prompted some homeowners to leave.
With the balance of power firmly tilted toward buyers, parts of Florida and Texas are seeing home prices fall. The median sale price in West Palm Beach dropped 3.5% year over year in July—the biggest decline in the country aside from Oakland, CA (also a buyer’s market). Austin came in third place, with a 3.3% decline.
On average, home prices were roughly flat (+0.5%) from a year earlier across the 35 buyer’s markets, compared with a 5.1% gain across the five seller’s markets.
Landin said the key to selling a home in today’s market is being patient, pricing for less than what comparable houses sold for three months ago and having a contingency plan if your worst case scenario becomes a reality.
Newark and Nassau County Are the Strongest Seller’s Markets, With About Half as Many Sellers as Buyers
Newark, NJ is the strongest seller’s market, with an estimated 5,591 sellers and 11,654 buyers—or 52% fewer sellers than buyers. The other four seller’s markets are Nassau County, NY (40.5% fewer sellers than buyers), Montgomery County, PA (36.1% fewer), New Brunswick, NJ (22.2% fewer) and Minneapolis (12.5% fewer).
New construction can have a significant influence on whether negotiating power lies with buyers or sellers because it impacts the balance of supply and demand. The South issues the most building permits, followed by the West, the Midwest and the Northeast. As mentioned earlier, many of the nation’s buyer’s markets are in the South, while the seller’s markets are all in the Northeast or Midwest.
San Antonio and Virginia Beach Have Shifted Most Toward Buyer’s Markets in Recent Months
San Antonio has 113.1% more sellers than buyers, up from 89.4% in April, when we last conducted this analysis. That 23.7-percentage-point gain is the largest among the 50 most populous metros. Next come Virginia Beach, VA (+19.2 ppts to 21.5%), Pittsburgh (+18.5 ppts to 32%), Denver (+16.1 ppts to 61.2%) and Charlotte, NC (+14.7 ppts to 80%).
Metro-Level Summary: 50 Most Populous Metros (July 2025)
| U.S. metro area | Balance of power | Percent more sellers than buyers | Sellers | Buyers | Median sale price | Median sale price: Y/Y change |
|---|---|---|---|---|---|---|
| Anaheim, CA | Buyer’s Market | 29.6% | 7,208 | 5,562 | $1,174,106 | 0.8% |
| Atlanta, GA | Buyer’s Market | 62.8% | 34,969 | 21,476 | $389,719 | -0.4% |
| Austin, TX | Buyer’s Market | 123.8% | 18,202 | 8,134 | $425,247 | -3.3% |
| Baltimore, MD | Balanced Market | -3.3% | 9,644 | 9,970 | $396,314 | 3.9% |
| Boston, MA | Balanced Market | -4.4% | 10,659 | 11,153 | $736,868 | 3.5% |
| Charlotte, NC | Buyer’s Market | 80.0% | 16,098 | 8,945 | $410,892 | 1.2% |
| Chicago, IL | Balanced Market | 1.3% | 25,715 | 25,379 | $359,301 | 3.0% |
| Cincinnati, OH | Balanced Market | 5.8% | 7,690 | 7,271 | $302,560 | 5.1% |
| Cleveland, OH | Balanced Market | -9.4% | 7,053 | 7,789 | $248,290 | 13.4% |
| Columbus, OH | Buyer’s Market | 21.9% | 8,743 | 7,174 | $347,099 | 2.9% |
| Dallas, TX | Buyer’s Market | 89.8% | 32,494 | 17,117 | $413,951 | -0.6% |
| Denver, CO | Buyer’s Market | 61.2% | 16,505 | 10,237 | $576,557 | -1.2% |
| Detroit, MI | Buyer’s Market | 17.7% | 7,036 | 5,980 | $204,012 | 5.1% |
| Fort Lauderdale, FL | Buyer’s Market | 151.2% | 20,988 | 8,356 | $443,349 | -1.2% |
| Fort Worth, TX | Buyer’s Market | 66.4% | 13,607 | 8,178 | $350,953 | -1.7% |
| Houston, TX | Buyer’s Market | 85.2% | 44,527 | 24,047 | $331,757 | -2.9% |
| Indianapolis, IN | Buyer’s Market | 25.1% | 8,955 | 7,159 | $315,193 | 7.3% |
| Jacksonville, FL | Buyer’s Market | 104.2% | 13,912 | 6,815 | $364,200 | -2.2% |
| Kansas City, MO | Buyer’s Market | 20.4% | 8,656 | 7,190 | $338,000 | 4.9% |
| Las Vegas, NV | Buyer’s Market | 94.8% | 13,803 | 7,084 | $437,976 | -0.9% |
| Los Angeles, CA | Buyer’s Market | 49.2% | 21,438 | 14,365 | $906,466 | 0.8% |
| Miami, FL | Buyer’s Market | 160.9% | 21,637 | 8,293 | $550,016 | -0.5% |
| Milwaukee, WI | Balanced Market | -4.5% | 4,674 | 4,894 | $340,882 | 2.8% |
| Minneapolis, MN | Seller’s Market | -12.5% | 13,143 | 15,028 | $388,285 | 2.8% |
| Montgomery County, PA | Seller’s Market | -36.1% | 4,903 | 7,672 | $495,527 | 6.9% |
| Nashville, TN | Buyer’s Market | 99.0% | 15,640 | 7,858 | $472,191 | 3.8% |
| Nassau County, NY | Seller’s Market | -40.5% | 7,503 | 12,604 | $729,268 | 6.6% |
| Newark, NJ | Seller’s Market | -52.0% | 5,591 | 11,654 | $617,719 | 5.7% |
| New Brunswick, NJ | Seller’s Market | -22.2% | 8,500 | 10,929 | $569,816 | 3.4% |
| New York, NY | Balanced Market | -4.9% | 28,681 | 30,170 | $786,295 | 3.9% |
| Oakland, CA | Buyer’s Market | 23.2% | 6,191 | 5,027 | $901,319 | -6.2% |
| Orlando, FL | Buyer’s Market | 79.5% | 19,020 | 10,598 | $406,214 | 0.0% |
| Philadelphia, PA | Buyer’s Market | 17.5% | 8,078 | 6,876 | $285,952 | 0.0% |
| Phoenix, AZ | Buyer’s Market | 53.7% | 31,561 | 20,529 | $452,799 | 0.1% |
| Pittsburgh, PA | Buyer’s Market | 32.0% | 9,185 | 6,961 | $243,135 | 4.4% |
| Portland, OR | Buyer’s Market | 31.8% | 9,362 | 7,101 | $550,210 | 0.9% |
| Providence, RI | Balanced Market | -6.1% | 4,331 | 4,610 | $505,762 | 3.7% |
| Riverside, CA | Buyer’s Market | 67.5% | 19,195 | 11,462 | $576,494 | -0.8% |
| Sacramento, CA | Buyer’s Market | 37.5% | 7,694 | 5,595 | $578,340 | -0.8% |
| St. Louis, MO | Balanced Market | 0.0% | 9,380 | 9,379 | $277,481 | 6.9% |
| San Antonio, TX | Buyer’s Market | 113.1% | 18,676 | 8,765 | $314,001 | 1.4% |
| San Diego, CA | Buyer’s Market | 20.3% | 7,944 | 6,604 | $899,368 | -0.3% |
| San Francisco, CA | Buyer’s Market | 17.3% | 2,742 | 2,337 | $1,485,384 | 0.1% |
| San Jose, CA | Buyer’s Market | 11.2% | 2,677 | 2,408 | $1,582,716 | 2.6% |
| Seattle, WA | Buyer’s Market | 25.4% | 9,450 | 7,537 | $817,850 | -1.4% |
| Tampa, FL | Buyer’s Market | 101.0% | 24,992 | 12,436 | $369,624 | -1.1% |
| Virginia Beach, VA | Buyer’s Market | 21.5% | 7,346 | 6,048 | $364,842 | 4.3% |
| Warren, MI | Balanced Market | -7.0% | 8,270 | 8,889 | $321,943 | 5.2% |
| Washington, D.C. | Buyer’s Market | 18.1% | 17,012 | 14,400 | $585,334 | 4.2% |
| West Palm Beach, FL | Buyer’s Market | 123.4% | 17,333 | 7,760 | $486,889 | -3.5% |
| United States of America | Buyer’s Market | 36.3% | 1,946,166 | 1,427,365 | $434,189 | 1.4% |